A Dynamic Tropopause & Rapid Changes in Ozone Concentrations
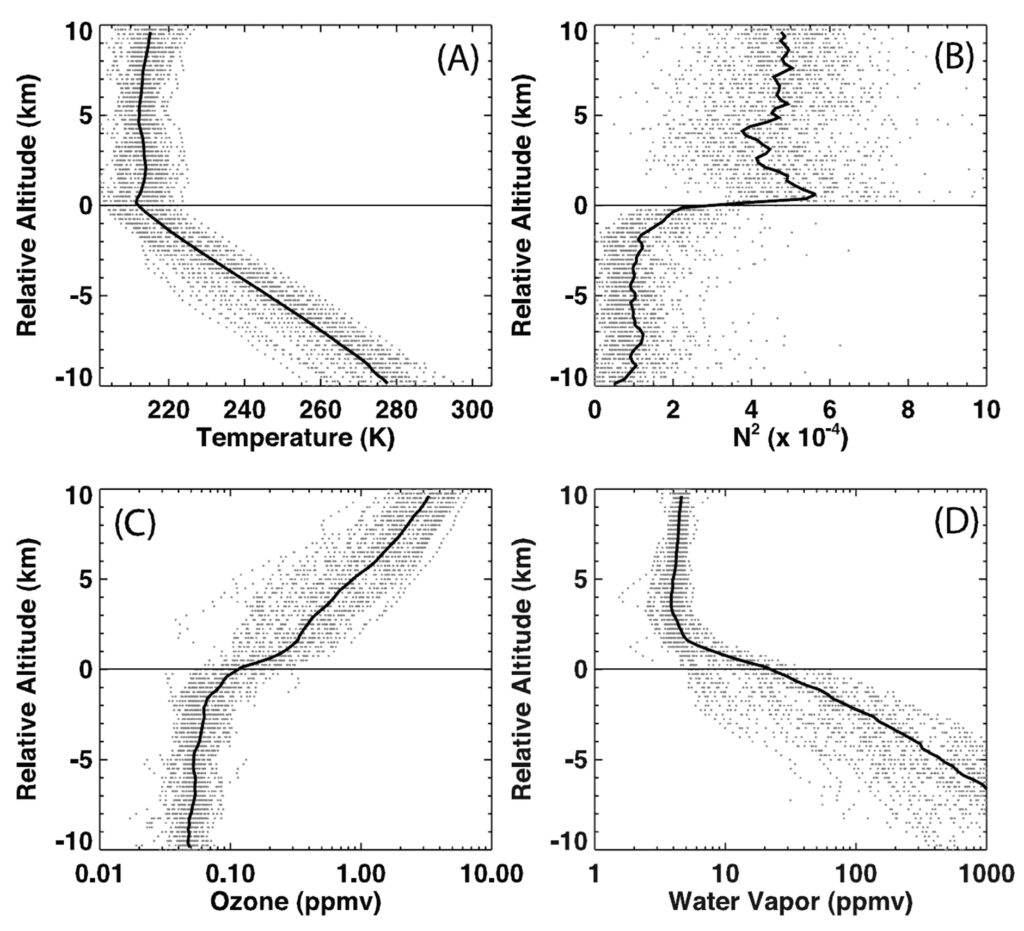
The tropopause is the boundary between the troposphere named from the Greek word meaning “to turn over” and the stratosphere named from the Latin word stratus meaning “to spread out”) — the boundary between air heated in a spatially varying way from below by a sun-warmed Earth, causing considerable turbulence, and air heated evenly from above by solar-energy-driven photochemical processes causing broad horizontal stratification. The tropopause “is defined as the lowest level at which the lapse rate decreases to 2oC km-1 or less, provided that the average lapse rate between this level and all higher levels within 2 km does not exceed 2oC km-1. Occasionally, a second tropopause may be found if the lapse rate above the first tropopause exceeds 3oC km-1” (WMO, 2013). At and above the tropopause, the static stability of the atmosphere suddenly increases, the amount of water vapor decreases, and the concentration of ozone increases.
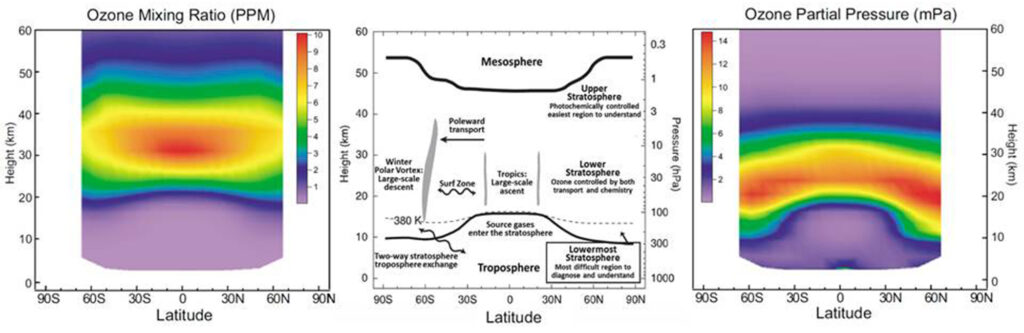
The tropopause is essentially the boundary between low ozone mixing ratios in the troposphere and high ozone mixing ratios in the stratosphere, which contains more than 90% of total column ozone (the amount of ozone in a vertical column of air from Earth’s surface to the top of the atmosphere) (Fioletov, 2008). It can be thought of as the altitude at which there is both sufficient partial pressure of ozone and sufficient solar ultraviolet radiation to photodissociate ozone thereby warming the stratosphere. When radiation absorbed by a gas has sufficient energy to cause photodissociation, all of the internal oscillatory kinetic energy contained in a molecular bond and all of the oscillatory energy absorbed from a field of radiation to break that bond is turned directly into translational kinetic energy of the molecules and atoms flying apart at high velocities. The temperature of gas is, according to the kinetic theory of gases and the ideal gas law, proportional to the average kinetic energy of translation among all of its constituent molecules. Photodissociation warms gases very efficiently, while absorption of radiant oscillatory energy insufficient to cause photodissociation has very little direct effect on raising the temperature of the atmosphere Follow the Energy.
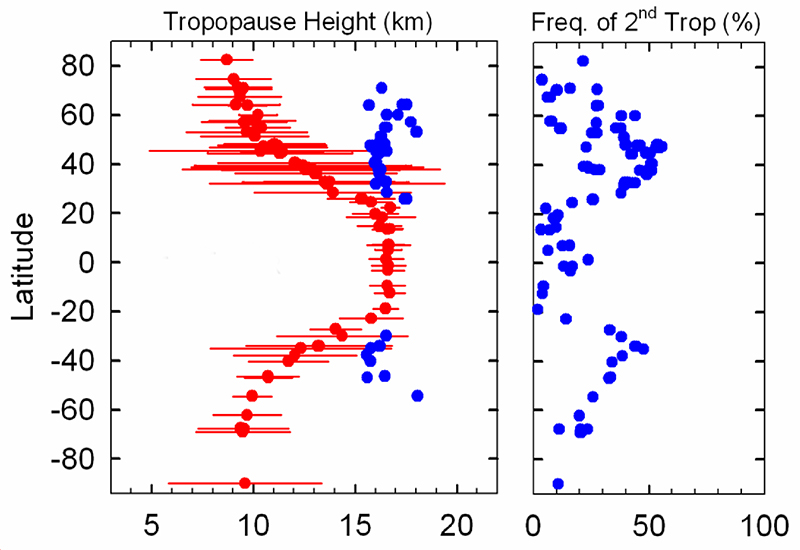
The average height of the tropopause varies from 16.6 km near the equator where solar radiation is most intense to 9 km near the poles (Seidel and Randel, 2006). Annual mean heights increased ~160 meters (1 to 2%) between 1980 and 2004 at the same time that northern mid-latitude total column ozone was depleted by ~4%, the lower stratosphere cooled ~2oC, the upper troposphere warmed ~0.1oC (Seidel and Randel, 2006), and mean surface temperatures in the northern hemisphere rose ~0.5oC (HadCRUT3nh, 2013).
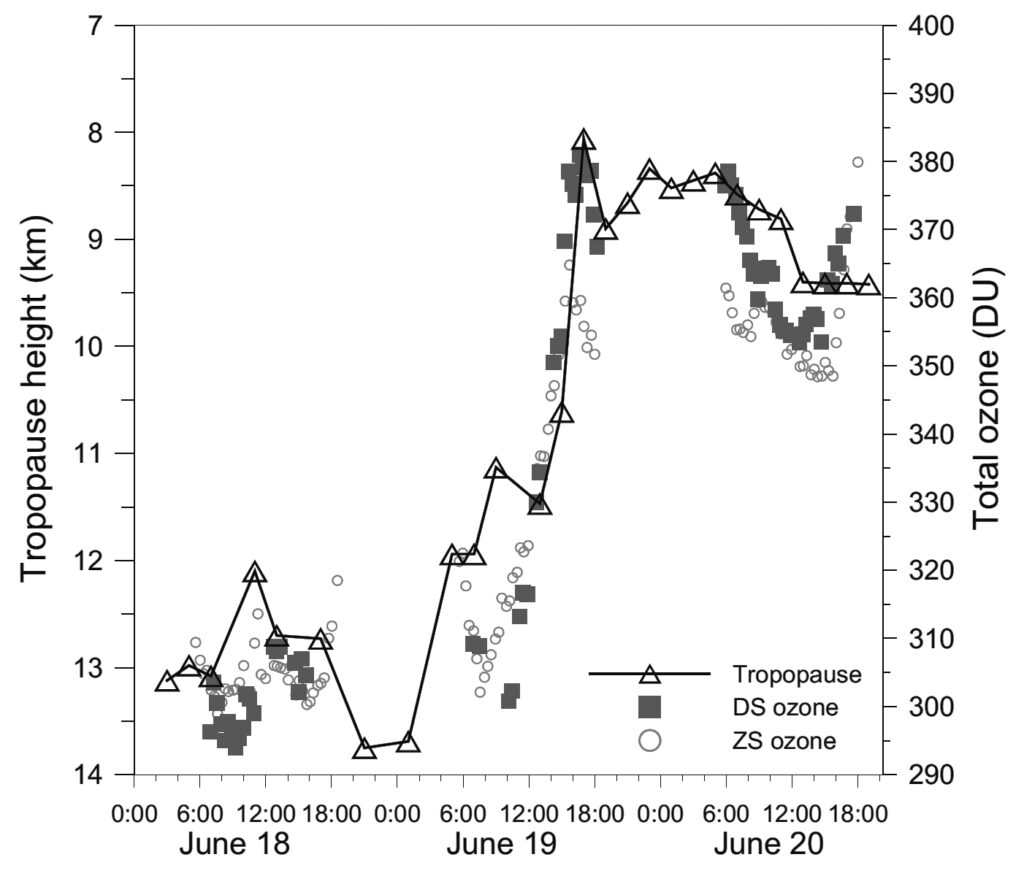
The tropopause is by far the most dynamic boundary in Earth’s atmosphere. On June 19, 2004, for example, the tropopause over Montreal, Canada, was observed by radar to drop from 13 to 8 km within 5 hours, contemporaneous with a local increase of more than 20% in total column ozone (Fioletov, 2008).
Measurements at each ozone-monitoring ground station (WOUDC, 2013) show that total column ozone amounts are continually changing even on a time scale of minutes especially during winter and spring near the edge of the polar vortex.
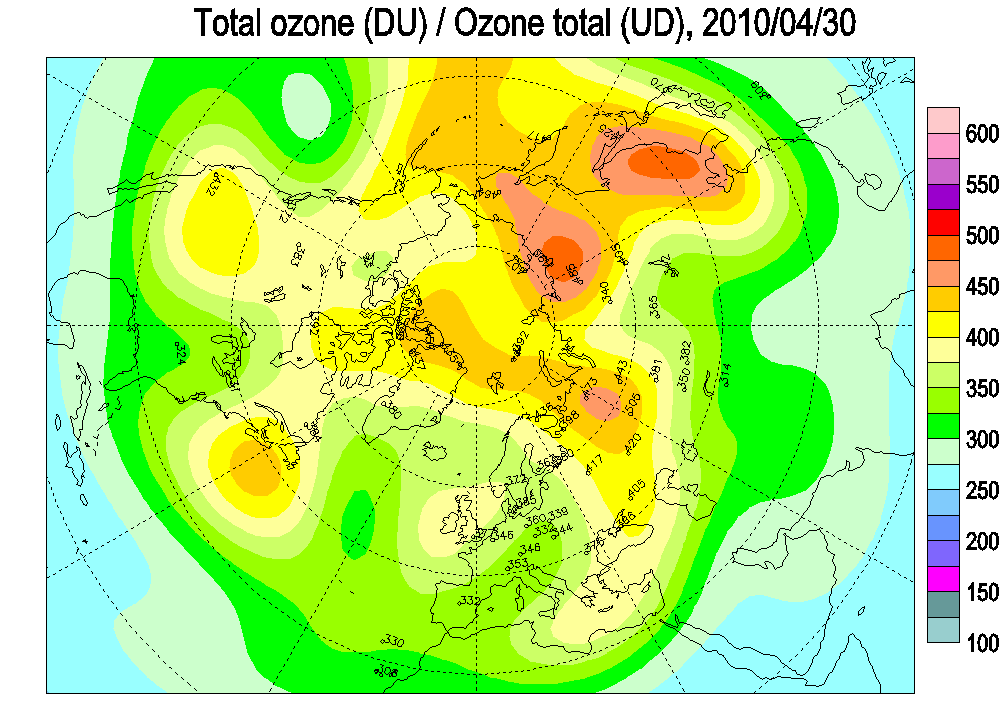
Averages of these large changes are now mapped daily throughout the world as observed from satellites and ground stations (Environment Canada, 2013). The figure on the right shows an animation of some of these daily ozone maps as well as a sudden increase by 70% of ozone northeast of Iceland primarily between February 19 and February 26, ~4 weeks before the first effusive flank eruption of basalt from March 20 to April 12 and ~7 weeks before the main explosive eruption of trachyandesite on April 14.
Observations that ozone concentrations increase prior to even small volcanic eruptions Pre-eruption Ozone and that ozone is depleted after volcanic eruptions of all sizes are discussed elsewhere on this website Ozone Distribution . They demonstrate that at least some of the regional changes in total column ozone concentrations appear to be caused by volcanism.
Reed (1950) points out that “from the time of Dobson’s early measurements” in the 1920s, “it has been known that the total ozone amount undergoes large day-to-day fluctuations. Data from stations in many parts of the world have revealed that these fluctuations are everywhere greatest in winter and spring, while in any one season they are greater at high than at low latitudes.”
“However, the day-to-day changes of total amount are not only of interest because of their amplitude — which, incidentally, is nearly as large as the amplitude of the seasonal variation — but also because of the relationships which have been established between them and various meteorological quantities.”
“Dobson et al. (1929) have shown that maximum positive deviations of daily values from the monthly means are generally found to the rear of surface low-pressure areas, while maximum negative deviations are found to the rear of surface highs. More recently, on the basis of more extensive measurements, Dobson et al. (1946) have refined the earlier results and found that for many occlusions the maximum positive deviations occur directly over the surface low rather than to the rear.”
“Tonsberg and Olsen (1943) have related the deviations of total ozone amount to surface fronts. In general, they found that the surface cold or occluded front is the dividing line between positive and negative departures.”
“In addition to the ozone-weather relationships discussed above, significant correlations have been obtained by (Meetham and Dobson, 1937) between total ozone amount and various meteorological quantities in the upper atmosphere. In particular, he found that the total amount correlates positively with the temperature and potential temperature in the lower stratosphere and negatively with the density and the height of the tropopause.”
Dobson and others had little evidence for physical or chemical processes that might change ozone concentrations directly other than the dynamical effects of synoptic weather systems scattering and concentrating ozone. With the advent of satellite systems, it has become possible to observe these variations with increasing precision (Allen and Reck, 1997) (Hood et al., 1997).
Staehelin et al. (2001) summarize that “extra tropical total ozone values vary in concert with a number of dynamical parameters such as the free tropospheric temperature (Staehelin et al., 1998), the lower stratospheric temperature (Tung and Yang, 1988) (Tung and Yang, 1988), the geopotential height (Ziemke et al., 1997), the potential vorticity of the lowermost stratosphere (Vaughan and Price, 1991), the tropopause height (Schubert and Munteanu, 1988) (Steinbrecht et al., 1998), and the tropopause pressure (Appenzeller et al., 2000).
Similarly (Shepherd, 2008) concludes that “chemical ozone loss is controlled by atmospheric dynamics. Dynamics explains why it is that ozone loss is much more severe in the Antarctic springtime than it is in the Arctic springtime. Dynamics also explains why ozone loss exhibits year-to-year variability even while the halogen loading evolves more smoothly and why this variability is largest in the northern hemisphere. Moreover, dynamical variability also leads to changes in ozone abundance through changes in transport. Observed changes in ozone thus result from both dynamical and chemical effects, in a non-additive manner.”
Ozone in the presence of sufficiently energetic ultraviolet radiation causes warming, no matter what the shape and extent of the ozone mass. Clear evidence exists for the role of ozone depletion in reducing lower stratospheric temperatures, increasing upper tropospheric temperatures, and allowing more high-energy solar ultraviolet radiation to reach Earth’s surface. Clear evidence also exists for rapid changes in ozone concentrations related to volcanism, even small eruptions occurring many times per year. Together these suggest that ozone variations may play a much more active role in atmospheric dynamics than currently assumed. Modeling these effects in the short-term could improve weather forecasting substantially; modeling these effects in the long-term could improve our understanding of global climate change.