The Primary Cause of Global Warming is Ozone Depletion
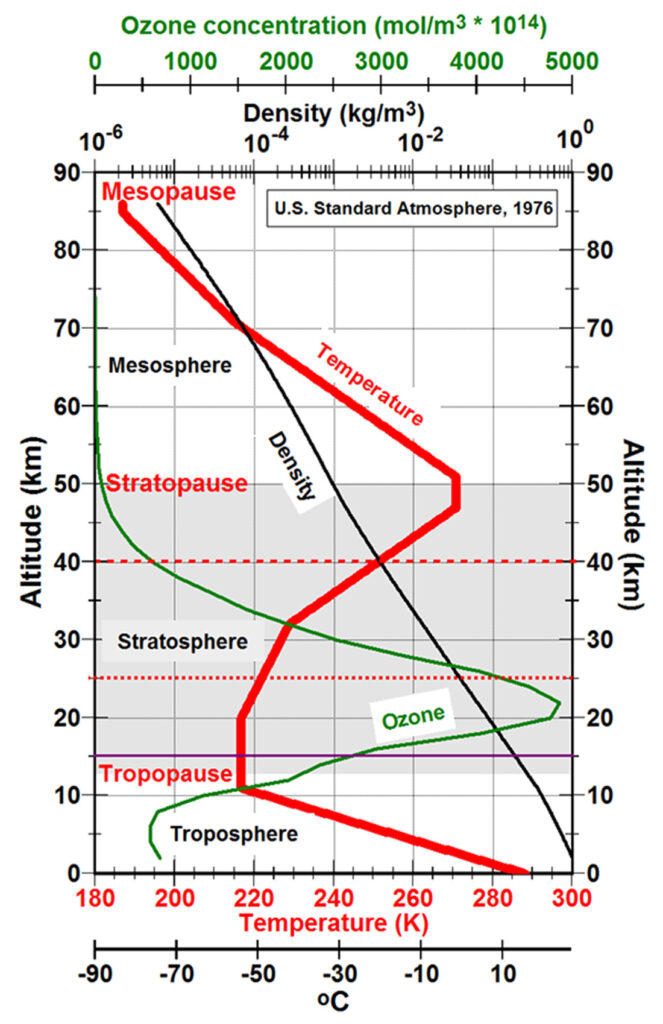
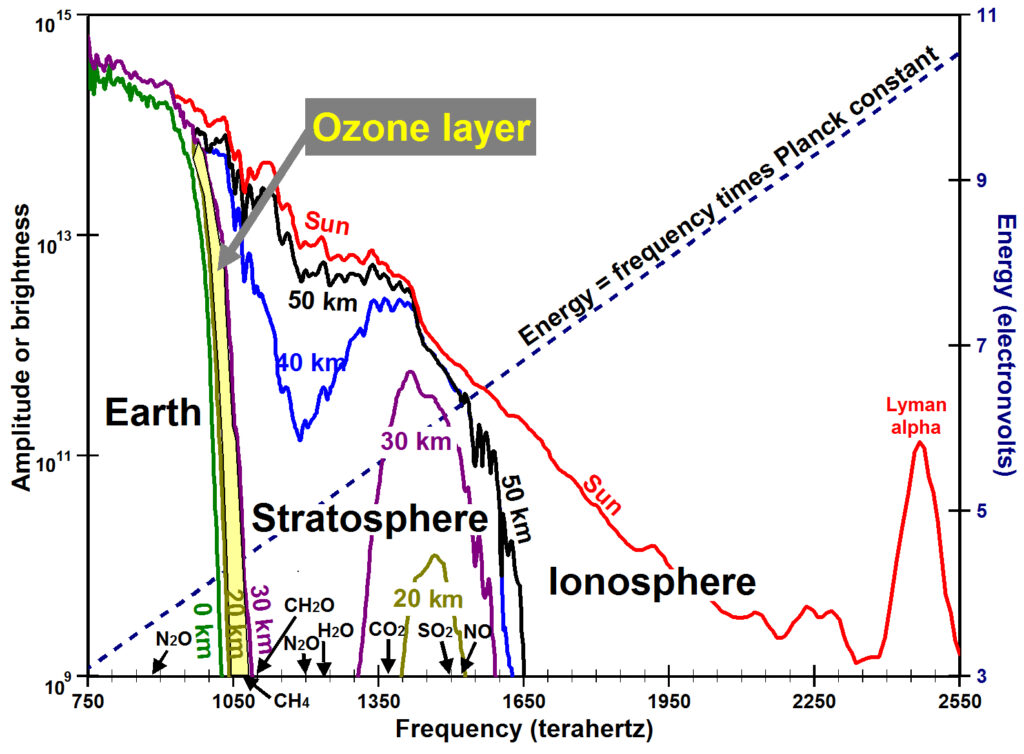
The greatest warming of Earth’s atmosphere is maintained daily in the stratosphere and mesosphere, where temperatures near the stratopause, at an altitude of approximately 50 km, are often 55oC warmer than temperatures at the tropopause at altitudes of less than 17 km (red line in the figure to the right). The energy for this warming comes from solar ultraviolet radiation. Global warming similarly appears to be caused primarily by a slight perturbation in atmospheric chemistry that determines how much of this solar ultraviolet energy warms the atmosphere and how much of it warms Earth. The atmosphere absorbs, is a filter for, the highest energy components of solar radiation and it is these components that determine the thermal, chemical, and physical structure of the atmosphere and the surface temperature of Earth. The amount (flux) of radiation from the Sun (red line) decreases rapidly as the wavelength of ultraviolet energy decreases. The most energetic wavelengths are progressively absorbed (filtered out) by the time the radiation reaches altitudes of 50 km (black line), 40 km (blue), 30 km (purple), 20 km (olive), and Earth’s surface (0 km, navy blue) (DeMore et al., 1997). Note that essentially all radiation with frequencies greater than 1034 terahertz has been absorbed by the time sunshine reaches Earth. Global warming occurs when some of this energy normally absorbed by ozone in the stratosphere reaches Earth’s surface.
According to the Planck postulate, the energy of radiation is equal to the frequency of the radiation times a constant. Thus ultraviolet A radiation (labeled in black near the top of the figure on the left) is up to 1.7 times more energetic that green visible light (532.5 nm, nanometers) (to the right of the graph), ultraviolet B is up to 1.9 times more energetic, and ultraviolet C is up to 5.3 times more energetic. Temperature of matter on Earth is proportional to its internal energy, which is determined by how much energy it absorbs from radiation and through conduction. The energy contained in ultraviolet B radiation is as much as 53 times the energy contained in infrared radiation at 14,900 nm (14.9 micrometers) absorbed strongly by carbon dioxide. Changes in thermal energy and therefore temperature are far larger for ultraviolet radiation than for infrared radiation.
Nearly all ultraviolet C solar radiation is absorbed in the stratosphere and above (figure on left). The amount of ozone, the “thickness” of the ozone layer (green line in the figure above right), in the lower stratosphere determines how much ultraviolet B radiation is absorbed in the stratosphere, warming the stratosphere, and how much is able to penetrate to Earth’s surface, warming Earth. When the amount of ozone in the stratosphere is depleted, more ultraviolet B radiation reaches Earth’s surface, cooling the stratosphere and warming Earth. Ultraviolet B radiation is absorbed most efficiently on Earth by the ocean, which contains the primary heat capacity of the Earth-atmosphere system. Depletion of stratospheric ozone warms the ocean, which warms near surface air temperatures. Let’s examine the details
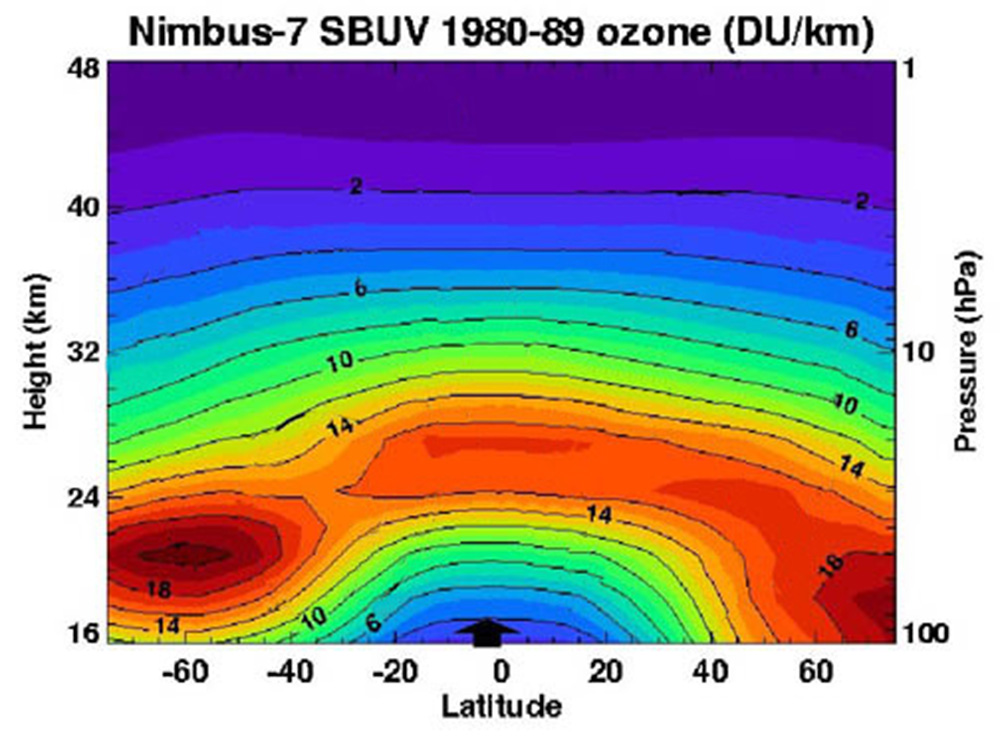
Atmospheric temperature close to Earth’s surface decreases with increasing altitude at an adiabatic lapse rate averaging 5.5oC/km for a wet atmosphere and 9.8oC/km for a dry atmosphere. But this cooling regime of the sun-warmed Earth changes suddenly into a warming regime above the tropopause formed at an average altitude of 16.6 km near the equator and 9 km near the poles (Seidel and Randel, 2006). Similarly, the base of the ozone layer is at an altitude of approximately 23 km in the tropics, 16 km in the Antarctic, and less than 14 km in the Arctic, approximately 6 km above the tropopause (figure right).
The atmosphere absorbs, through photoionization and photodissociation, most of the highest energy components of solar radiation and thus determines how much solar energy reaches Earth’s surface. The red line in the figure (above left) shows the actinic flux of ultraviolet radiation received at the top of the atmosphere from the Sun (DeMore et al., 1997). Actinic flux is the quantity of radiation at a point in the atmosphere “used to calculate various photodissociation rates that are used to describe the photochemistry of the atmosphere” (Kylling et al., 2003). While the observed spectral amount of solar radiation peaks at 451 nm in the blue part of the visible spectrum and remains high throughout the visible spectrum (400 to 750 nm) (Gueymard, 2004), the energy contained in solar radiation is highest and increasing at wavelengths less than 400 nm as shown by the dashed green line based on Planck’s postulate (Energy=hν equals the Planck constant h times the frequency ν, the Greek letter nu). The energy contained in radiation with a wavelength of 400 nm is 3.1 electron volts (eV).
The highest energies are absorbed through photoionization of gases such as nitrogen and oxygen, forming the ionosphere at altitudes above 85 km. Nitrogen (N2), making up 78% of the volume of the atmosphere, persists primarily because it can only be destroyed (ionized) at energies >10 eV (wavelength λ<124 nm) (Wight et al., 2001). Note that most energy with wavelengths (λ) less than 178 nm (>7.0 eV) has been absorbed by the time solar radiation reaches the stratopause at an altitude of 50 km (black line). This is the highest energy radiation as shown by the dotted green line.
Lower energy radiation around 5 eV is absorbed in the mesosphere and stratosphere photodissociating oxygen. Still lower energy radiation around 4 eV photodissociates ozone initiating catalytic processes in the lower stratosphere that form and dissociate ozone over and over, heating the lower stratosphere. At an altitude of 40 km (blue line), much of the energy at wavelengths of 240 to 260 nm (energies of 5.2 to 4.8 eV) has been absorbed. At Earth’s surface (navy blue line), essentially all solar radiation with wavelengths less than 295 nm (energies greater than 4.2 eV) has been absorbed in the atmosphere through photoionization in the ionosphere and photodissociation in the mesosphere and stratosphere.
When the amount of stratospheric ozone is depleted, it is this energy, which normally causes photodissociation and resulting warming of the lower stratosphere, that is able to penetrate into the troposphere and down to Earth’s surface, cooling the stratosphere and warming Earth.
Modern chemical-transport climate models include more than 45 photodissociation reactions (Kinnison et al., 2007) occurring primarily at wavelengths (λ) less than 400 nm. The onset of photodissociation is shown along the bottom axis for some important gases (Turco, 1975) (Hydutsky et al., 2008). In addition, HO2 is dissociated for λ<456 nm; HNO3 for λ<598 nm; N2O5 for λ<750 nm (Turco, 1975). Quantitatively the most important photodissociation reactions involve oxygen that makes up 20.95% of the volume of the dry atmosphere, two orders of magnitude more than the volume of all other reactive gases combined.
In 1930, Sydney Chapman described the formation and destruction of ozone in the stratosphere in what has become known as the ozone-oxygen cycle, the Chapman cycle or the Chapman mechanism (Chapman, 1930, pdf):
| O2 + hv(λ<242.4 nm) → O(3P) + O(3P) | (1) |
| O(3P) + O2 + M → O3 + M | (2) |
| O3 + hv(λ<310 nm) → O2 + O(1D) O(1D) + M → O(3P) + M | (3) |
| O(3P) + O3 → O2 + O2 | (4) |
| O(3P) + O(3P) + M → O2 + M | (5) |
Equation 1: The bond of an oxygen atom (O2) in the presence of solar radiation containing enough energy (hv) at wavelengths less than 242.4 nm (frequency >1240 terahertz, energy >5.11 eV) resonates with high enough energy to overcome the bond-energy, forming two oxygen atoms in ground-level triplet state O(3P). O2 has been dissociated in the laboratory for λ<248 nm (Slanger et al., 1988). Dissociation occurs over a much broader wavelength band due to details of the absorption process and energy added by various combinations of vibrational and rotational transitions. This reaction heats the atmosphere because the oxygen atoms fly apart at high velocity and the temperature of a gas is proportional to the average translational velocity of all of the molecules and atoms. There is more than enough oxygen to absorb most of the solar wavelengths between 230 and 275 nm providing the primary heating of the stratosphere at altitudes of 15 to 50 km. The number of atoms split depends on the amount or intensity of these wavelengths present in the sunlight.
Equation 2: The ground-level triplet state O(3P) oxygen atoms are highly reactive due to the presence of two unpaired electrons and combine rapidly with an O2 molecule to form ozone (O3). M is any non-reactive molecule that can take up energy released in the reaction to stabilize O3. O3 is a very unstable molecule that might immediately fall apart to form O and O2 again without the presence of M. M is typically nitrogen (N2) making up 78.09% of the atmosphere by volume, but might be O2 making up 20.95% or any other non-reactive molecule available in trace amounts.
Equation 3: The ozone molecule in the presence of solar radiation with wavelengths less than 310 nm (frequency >967 terahertz, energy >4.0 eV) is split into an oxygen molecule (O2) and an oxygen atom in the excited singlet state O(1D). This reaction has been observed in the laboratory for λ<336 nm (Silvente et al., 1997) (Finlayson-Pitts and Pitts, 1999, p. 93). Typically O(1D) is rapidly deactivated upon collision with M to form a ground-level triplet state oxygen atom O(3P).
Equation 4: O(3P) can combine with O3 to form two oxygen atoms (O2).
Equation 5: O(3P) can combine with O(3P) in the presence of M to form an oxygen atom (O2).
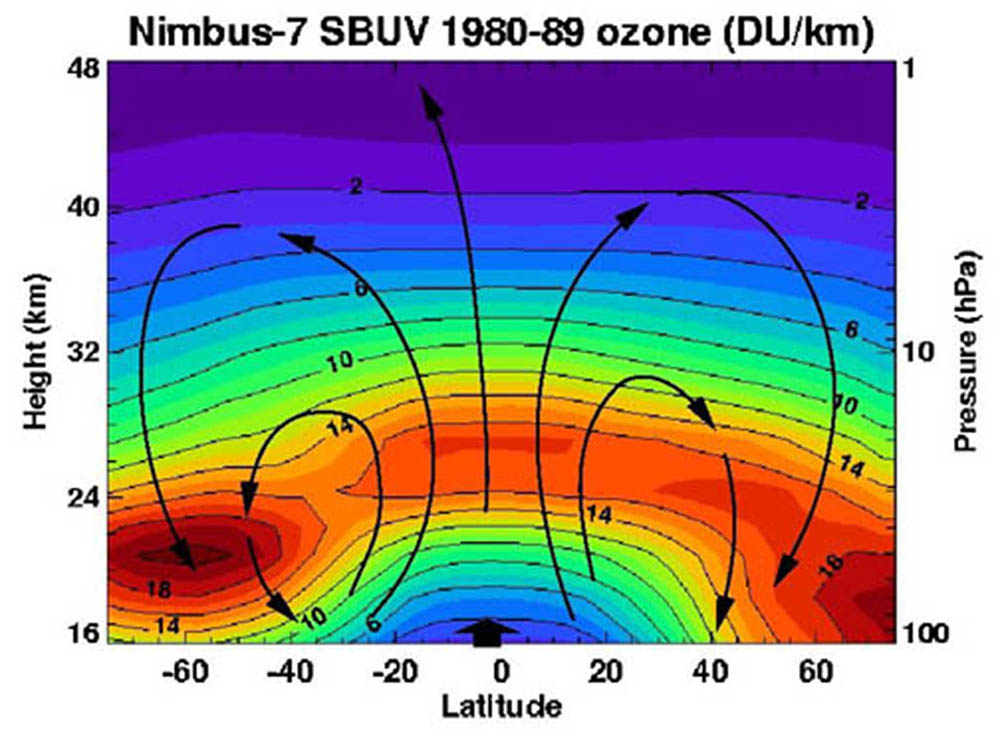
Reactions 2 and 3 happen much faster than reactions 1 and 4 (Jacob, 1999). Thus there is rapid cycling between O and O3 with slower cycling between O2 and either O or O3. The mean lifetime of a molecule of ozone in the stratosphere when sufficient radiant energy is available may be less than seconds. What we observe as a “layer” of ozone is actually a region of the atmosphere where the Chapman cycle works most efficiently, reaching an equilibrium concentration of ozone. “The total mass of ozone produced per day over the globe is about 400 million metric tons! The global mass of ozone is relatively constant at about 3 billion metric tons, meaning the Sun produces about 12% of the ozone layer each day” (Newman, 2013). Individual molecules are constantly changing but the net concentration changes more slowly as a function of changes in the physical conditions that promote the Chapman cycle, primarily the energy spectrum and the amount of solar radiation present. The ozone layer is not a static layer of a long-lived gas, it is a region of the atmosphere where ozone is continually created and destroyed. Any change in the physical and chemical properties of this region may enhance or deplete the amount of ozone observed and these changes can be very rapid. From this perspective, the concept of a Brewer-Dobson circulation (figure left) is misleading. The distribution of ozone throughout the atmosphere is not determined by how ozone gas is circulated, but how the physical and chemical conditions that influence the Chapman cycle change in location and time. The amount of total column ozone above any point on Earth changes constantly on a time scale of minutes (WOUDC, 2013).
Ozone makes up only ~0.000007% of dry air by volume (<70 parts per billion), but unlike nearly all other important gases is not well mixed because its concentration depends on the relative amounts of energy available around 242.4 nm to produce ozone (dashed black line in the top, left figure near the top of the webpage) and around 310 nm to dissociate ozone (dotted black line). Ozone is typically formed, dissociated, and formed again catalytically and both formation and dissociation generate heat, so the net ozone can be thought of as a heating element powered by continued release of energy via photodissociation. Concentrations of ozone are greatest in the ozone layer between 15 and 35 km, but the thickness and concentrations of this layer vary seasonally and geographically (Click here to see a figure).
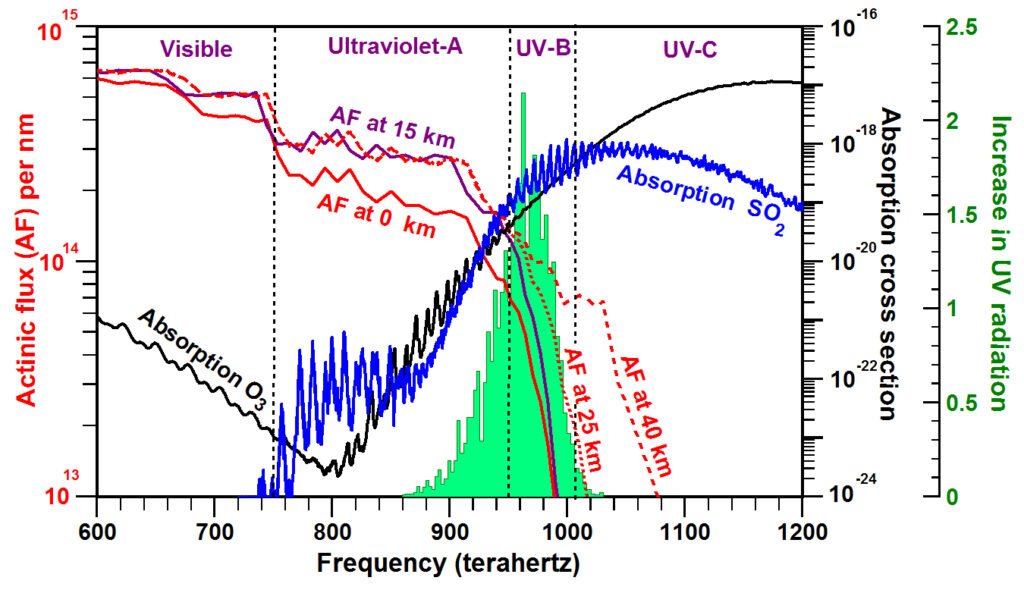
The photochemistry and the physics behind global warming is shown more clearly in the figure on the right. The spectrum of radiation available from an overhead sun that normally reaches a given altitude is shown by actinic flux (AF), another way of looking at spectral radiance, as estimated by Madronich in Tables 3.7, 3.15, 3.16, 3.17 of Finlayson-Pitts and Pitts (1999). The increase in solar flux reaching the ground is confined to a very narrow bandwidth (green shaded area) (Madronich, 1993) between the rapidly increasing absorptivity of ozone above 857 terahertz (350 nm) (black line) (Rothman et al., 2013) and the very rapidly increasing availability of solar energy below 1034 terahertz (290 nm) (red and purple lines). Between 1979 and 2008, average solar ultraviolet flux under clear-sky conditions reaching Earth’s surface at 50oS was observed by satellite to increase 23% at 305 nm (983 terahertz) but only 10% at 310 nm (967 terahertz); at 50oN, solar ultraviolet flux increased 9% at 305 nm but only 4% at 310 nm (Herman, 2010).
Absorption by the ozone layer is essentially the difference in actinic flux at 40 and 15 km (dashed red and solid purple lines respectively). A 50% decrease in total column ozone will increase UV radiation at Earth’s surface by ~2 W m-2 for overhead sun (red shaded area) and ~0.5 W m-2 for a solar zenith angle of 70o (Madronich, 1993). When integrated over the whole world, these changes in UV radiation are likely to cause most of observed global warming thought to be caused by an increase in radiation received at Earth’s surface of ~0.9 W m-2 (Trenberth et al., 2009). The amount of heating will need to be calculated more precisely when atmospheric models have been improved to handle the issues regarding spectral radiance, photodissociation, and absorption discussed on this website.
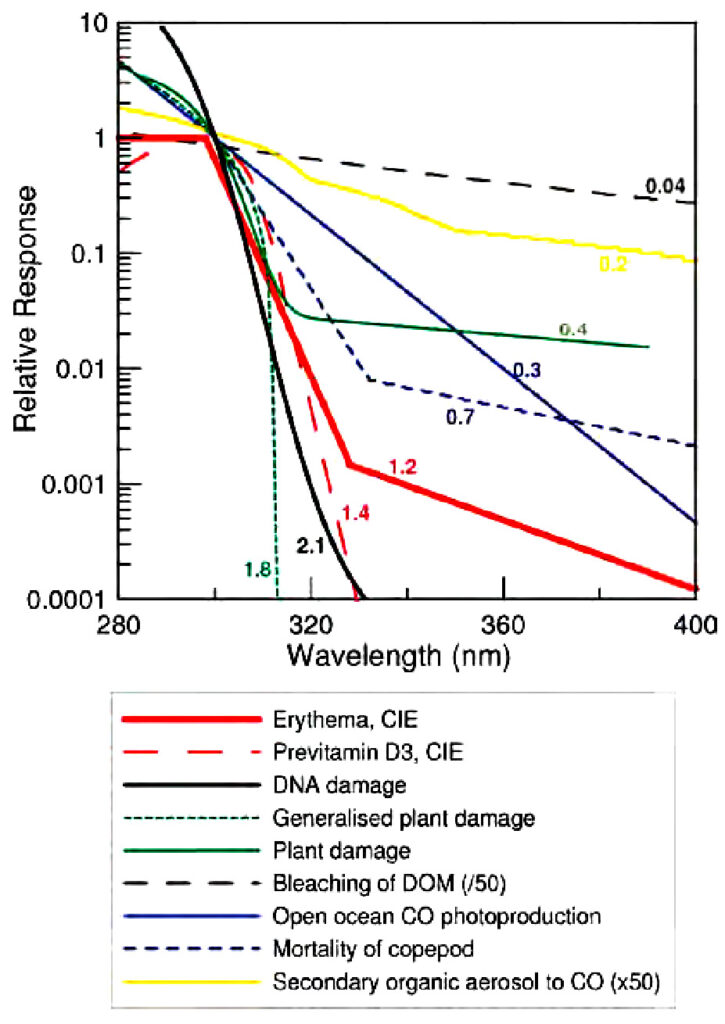
This narrow band (green shaded region) of increased ultraviolet energy, known as erythemal radiation or sun-burning radiation, has been measured and studied in considerable detail from the health perspective (Norval et al., 2011). For every 1% decrease in ozone in the stratosphere, an additional 2% of erythemal radiation reaches Earth (Moore et al., 2007, p. 463). The figure on the left from (McKenzie et al., 2011, Fig. 6) shows as a function of wavelength the relative response of skin (Erythema) (red), previtamin D3 (dashed red), DNA (black), plants (green), bleaching of dissolved organic matter (DOM) (dashed black), open-ocean photoproduction of carbon monoxide (CO) (blue), copepod mortality (dashed blue), and secondary organic aerosols (yellow). Note how the sensitivity increases rapidly as the wavelength decreases from 320 to 300 nm.
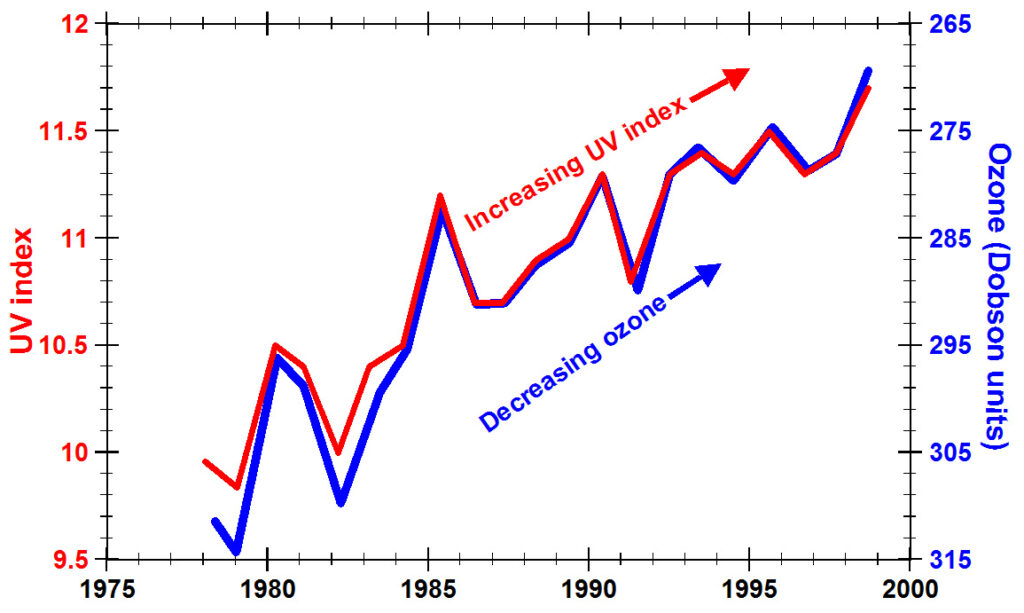
The strength of ultraviolet (UV) radiation, the UV index, can be measured at a specific place and time and can be calculated based on total column ozone in the atmosphere above that point. The blue line (above right) (y-axis reversed) shows the decrease in ozone measured during summers from 1978 to 1999 over Lauder, New Zealand (45oS) (McKenzie et al., 1999). The red line shows the predicted UV index (McKenzie et al., 1999).
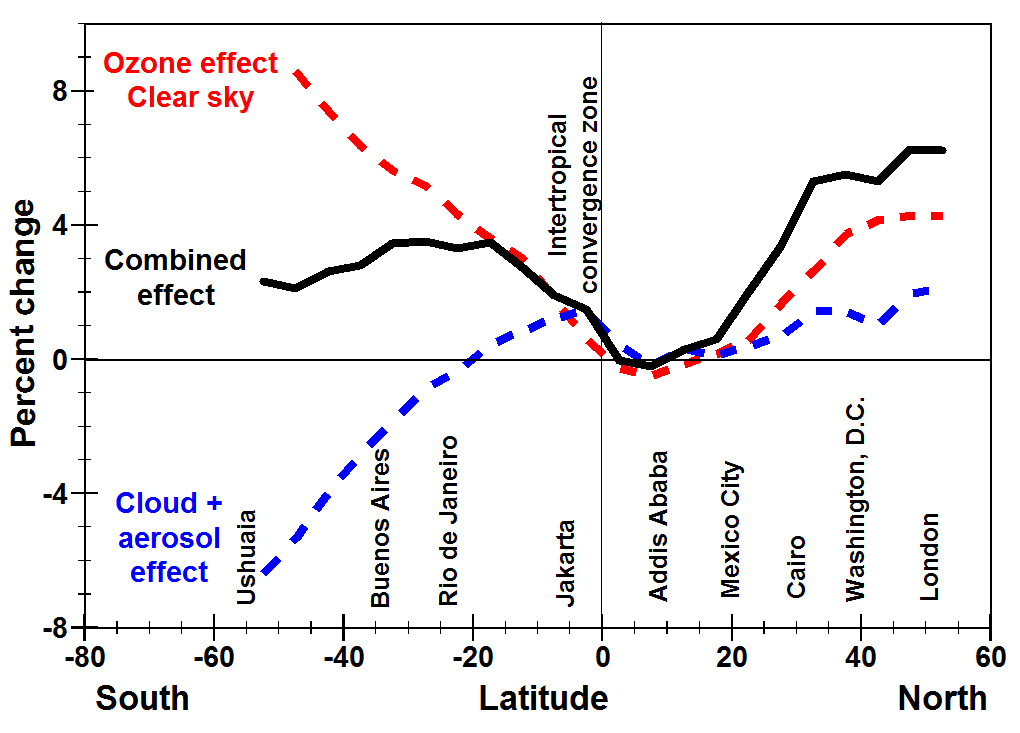
The figure on the right shows the percent change in erythemal irradiance (black line) from 1979 to 2008 as a function of latitude (Herman, 2010). The dashed red line shows the effect of ozone depletion for a clear sky. The dashed blue line shows the effect of clouds and aerosols. Click on the figure to see a version with error bars around each of the data points. The combined effect (black line) is greatest in the northern hemisphere, agreeing with the observation that global warming, during the same period of time, was greater in the northern hemisphere (HadCRUT3nh, 2013).
The Chapman cycle predicts that ozone amounts should be nearly twice as high as observed. While the Chapman cycle produces ozone, there are many reactions involving
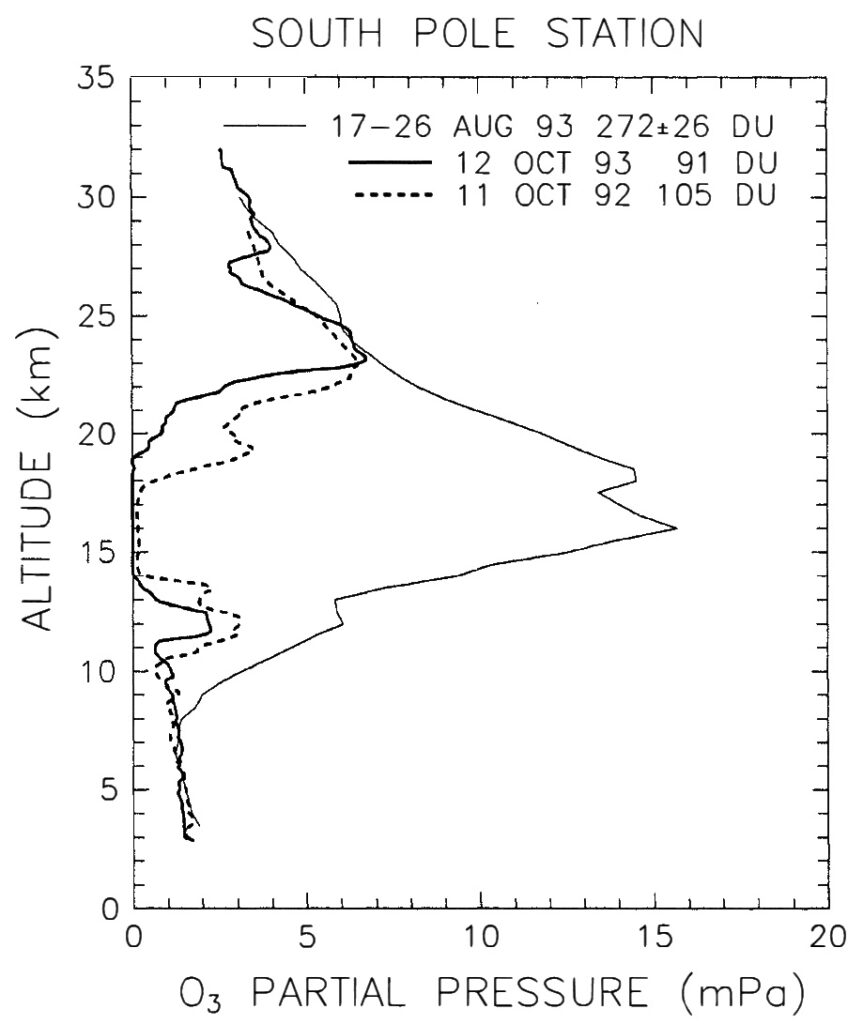
chlorine, bromine, nitrogen, and hydrogen that deplete ozone through catalytic reactions described in detail by Jacob (1999, Chapter 10), Newman (2013), Finlayson-Pitts and Pitts (1999, Chapters 4 & 12) and many others. The greatest depletion is observed within the polar vortex over Antarctica and is caused by anthropogenic chlorofluorocarbons that release chemically active chlorine in reactions taking place on the surfaces of ice crystals in polar stratospheric clouds at temperatures below -83oC (Molina and Rowland, 1974). The greatest depletion of ozone is in the lower stratosphere at altitudes from 10 to 20 km, which normally would contain most of the ozone column in polar spring (figure to the left). But it is clear from the figure above right that ozone depletion also occurs in much more temperate zones. The major depletion following the 1991 eruption of Mt. Pinatubo in the Philippines has been explained as a result of heterogeneous chemical reactions associated with the surface of the sulfuric acid aerosol formed in the lower stratosphere, but similar amounts of depletion are observed following effusive volcanoes that do not form aerosolsOzone Depletion. Volcanoes, even quietly degassing volcanoes (von Glasow et al., 2009), emit large quantities of bromine and chlorine (Vance et al., 2010). Plus ozone can appear depleted if any of the physical, chemical, or photochemical processes in the Chapman cycle are inhibited for any reason. The most important observation is that there are many reasons why ozone concentrations vary continuously and why there can be different time scales. Depletion caused by volcanism appears to last no more than a decade Ozone Depletion. Depletion caused by anthropogenic chlorofluorocarbons appears to last for nearly a century (Solomon, 1999).
The amount of ozone primarily in the lower stratosphere determines at what altitude solar warming of the atmosphere begins — the altitude of the tropopause — and how much thermal energy is released in the stratosphere versus how much reaches Earth — the amount of global warming. Ozone exists in the atmosphere within a very delicate equilibrium. Short-term changes affect weather; long-term changes affect climate.