Why Did Global Warming Stop in 1998?
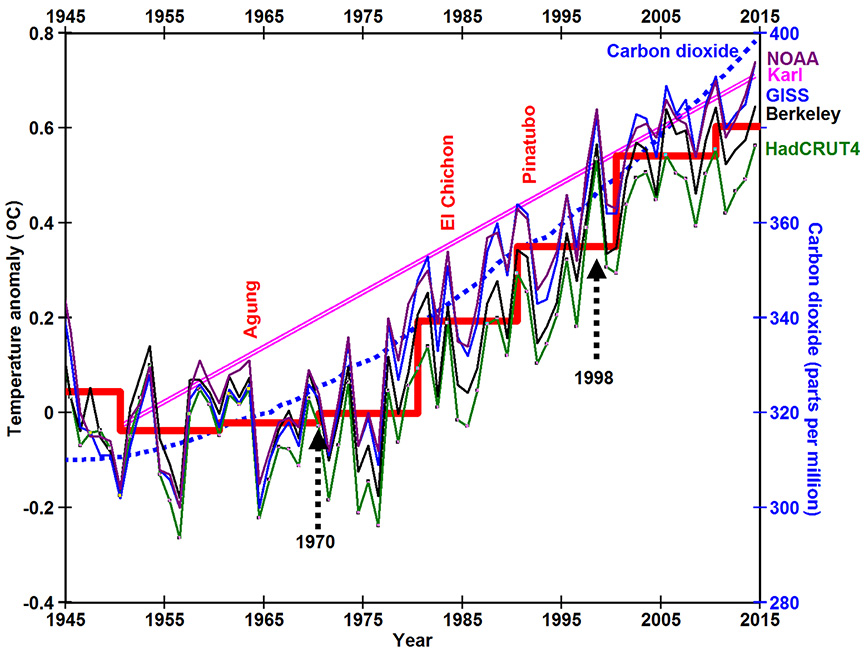
Annual mean surface temperatures (red line to the right) have not risen much if any since 1998 (Knight et al., 2009). Temperatures similarly did not change much from 1945 to 1970. Global warming in the past 70 years occurred predominantly during the 28 years from around 1970 to 1998. All four major temperature data sets plotted in the figure to the right show the same basic trend.
Meanwhile concentrations of carbon dioxide (CO2) (blue line) (NOAA) have continued to rise at ever increasing rates. The sudden increase in temperature beginning around 1970 and ending in 1998 is a trend that is distinctly different from the continuous increase in carbon dioxide from 1945 to present. Dozens of scientific papers have been written trying to explain this stark difference in terms of natural variation of climate systems. Nevertheless, many scientists are beginning to agree that 16 years of relatively constant temperatures since 1998 is becoming harder and harder to explain based on greenhouse gas theory, which says that increases in temperature are proportional to increases in the concentrations of greenhouse gases.
This website explores in detail an alternative theory: the Ozone Depletion Theory of Global Warming. Ozone is a trace gas in Earth’s atmosphere that is formed and destroyed in an endless cycle (the Chapman cycle) driven by solar ultraviolet (UV) radiation. Ultraviolet-C radiation with energy greater than 5 eV (electron volts) is able to split (photodissociate) molecular oxygen (O2) into two oxygen atoms (2O), heating the stratosphere. An O2 molecule and an O atom can then combine to form ozone (O3). Since oxygen makes up nearly 21% of Earth’s atmosphere, there is more than enough oxygen to absorb all available solar energy greater than 5 eV within the stratosphere.
Solar ultraviolet-B radiation with energy greater than 4.1 eV is able to photodissociate O3 back into O2 plus O, heating the stratosphere. Ozone is formed primarily between 15 and 35 km above Earth’s surface where there are at most only eight molecules of ozone for every million molecules of gas. The so-called ozone layer is more accurately thought of as a region of the atmosphere where the physical conditions promote the Chapman cycle. Any change in these conditions will cause the concentration of ozone in the “ozone layer” to be enhanced or depleted.
The ozone depletion theory of global warming simply says that when the ozone layer is depleted from its normal concentration, more ultraviolet-B radiation will reach Earth causing warming of Earth’s surface and cooling of the lower stratosphere, and when the ozone layer is enhanced, as it is in polar regions during local winter, less ultraviolet-B radiation reaches Earth causing regional cooling and warming of the lower stratosphere.
Current climate models assume that energy in radiation is a function of bandwidth as would be the case if radiation were to travel in space as a wave. But waves deform matter and there is no matter in space to deform. Radiation in space and in the atmosphere is simply frequency. Max Planck showed in 1900 that the energy contained in radiation is equal to frequency times a constant. Therefore the energy in high-frequency ultraviolet-B radiation is approximately 48 times greater than the energy in lower-frequency infrared radiation absorbed most strongly by carbon dioxide. Long-term global warming is proportional to the amount of energy added primarily to the oceans.
The normal optical thickness of the ozone layer plays a lead role in setting the average temperature of Earth’s surface. It seems quite logical, then, that changes in concentrations of ozone would cause changes in climate. Total column ozone, the amount of ozone in a vertical column above a point on Earth, varies by the minute, time of day, season, and latitude (WOUDC, 2014). But annual averages at each station tend to be similar and it is these averages that relate most directly to annual average surface temperatures.
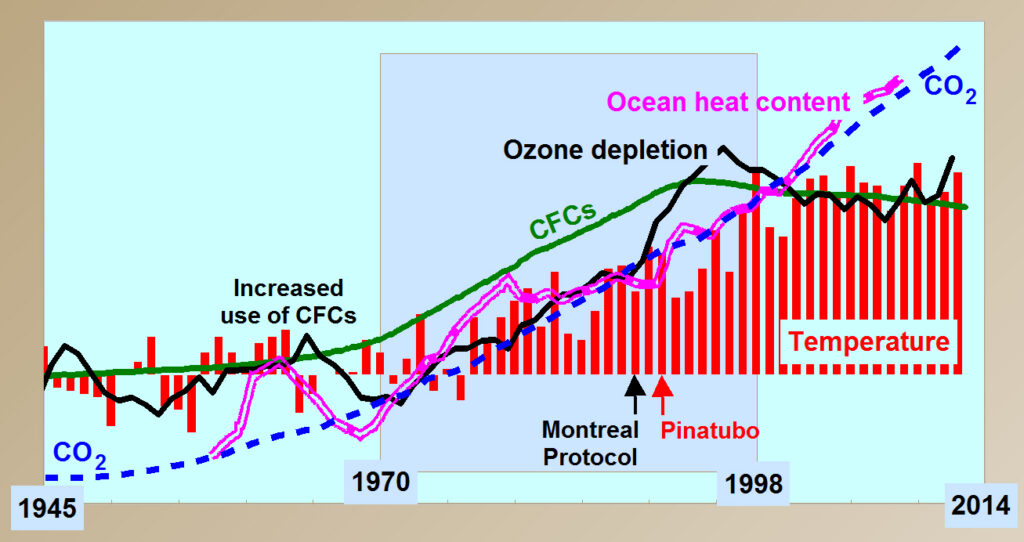
Ozone is depleted by chlorofluorocarbon gases (CFCs) manufactured by humans for use as refrigerants, solvents, spray-can propellants, and fire retardants. Rapid increase in use of CFCs by 1970 appears to have caused the onset of global warming. The Montreal Protocol on Substances That Deplete the Ozone Layer, effective January 1, 1989, led to a rapid decrease in emissions of CFCs, ending the increase in ozone depletion by 1996 and the increase in temperature by 1998. Qing-Bin Lu has similarly argued that “global temperature has been dominantly controlled by the level of CFCs … over the past century” (Lu, 2010) (Lu, 2010) (Lu, 2013).
Ozone is also depleted by chlorine and bromine gases emitted by volcanoes. Major effusive, basaltic volcanoes deplete ozone, warming Earth, while major explosive volcanoes also form aerosols in the lower stratosphere that reflect and scatter sunlight causing net cooling. A balance between the duration of effusive volcanoes causing warming and the rate of major explosive volcanoes causing cooling appears to have controlled climate throughout geologic time.