Animation of Daily Ozone Maps from December 1, 2009 to April 20, 2010
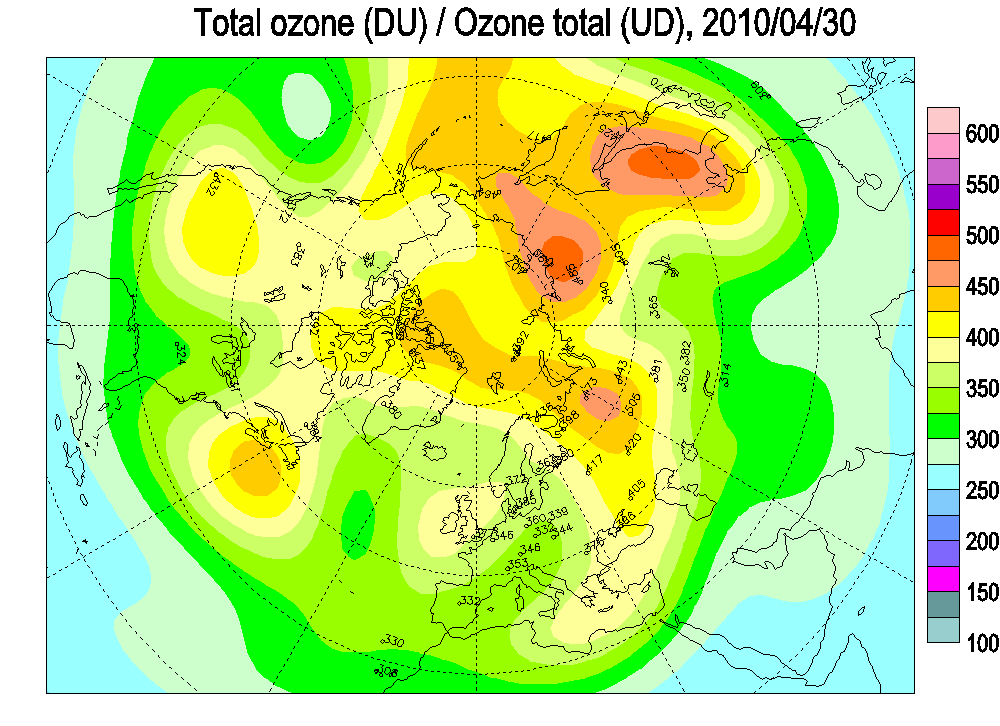
An animation of daily ozone maps from December 1, 2009 to April 20, 2010 showing major increases in ozone from February 21 to 28 northeast of Iceland. The total ozone anomaly was >550 DU on February 19, 2010, based on the satellite borne Total Ozone Mapping Spectrometer (TOMS) integrated with data from ground stations (Environment Canada, 2013).