Atmospheric Profile
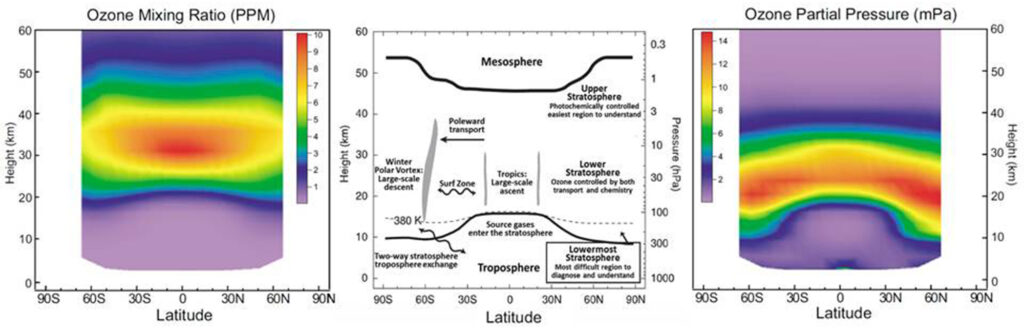
Left panel: Annual mean ozone mixing ratio in ppm as a function of latitude and altitude. Data from SAGE II (version 6.20) for 1984–2004.
Middle panel: Schematic diagram showing the structure of, and transport within, the stratosphere (reproduced from Figure 4-1 of WMO, 2003). The main tropopause (solid black line at 10 to 15 km) lies close to the altitude where ozone partial pressure is less than 2 milliPascals. The second tropopause (near 16 km) lies close to the altitude where the ozone mixing ratio is less than 2 parts per million (Fioletov, 2008).
Right panel: Annual mean ozone partial pressure in mPa as a function of latitude and altitude. Data from SAGE II (version 6.20) for 1984–2004.
Ozone mixing ratio is the abundance of ozone relative to that of all other gases.
Ozone partial pressure is the hypothetical pressure of that gas if it alone occupied the volume of the mixture at the same temperature.
This figure is copied from Figure 1 of Fioletov (2008).