Climate Trends: Ozone Depletion was Contemporaneous with Warming
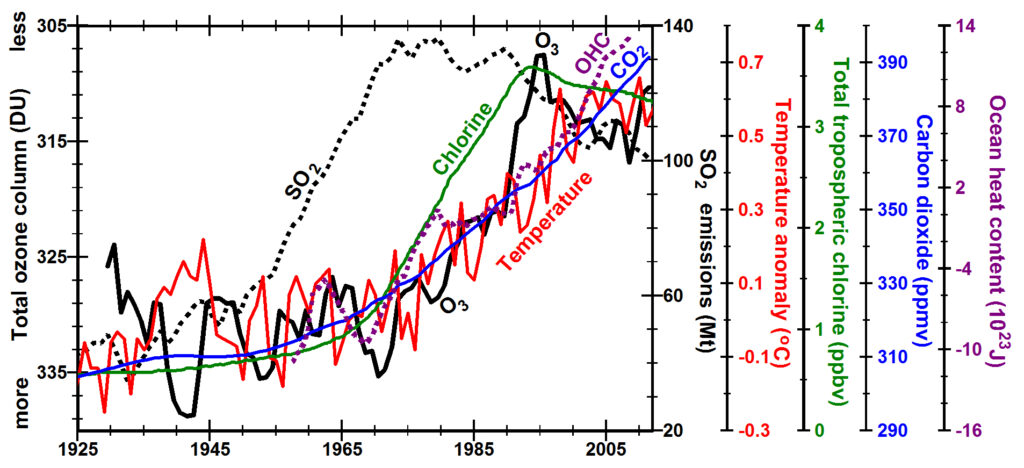
Annual mean surface temperatures (red line) (NOAA, 2014) increased during the 1930s, cooled during the 1940s, remained relatively constant until 1975, rose rapidly until 1998 with a net temperature increase of ~0.8oC, and have remained relatively constant until 2011 (Trenberth, 2009) (Knight et al., 2009, S22-S23). Other compilations of instrumental temperatures (Hansen et al., 2010) (HadCRUT3, 2014) (Smith et al., 2008) (Muller et al., 2013) and analysis of 173 proxies for temperature since 1880 (Anderson et al., 2013) show similar trends.
Concentrations of total tropospheric chlorine caused by anthropogenic chlorofluorocarbons (green line) increased rapidly from 1970, reached a peak in 1993 due to implementation of the Montreal Protocol and continue to decline slowly (Solomon, 1999).
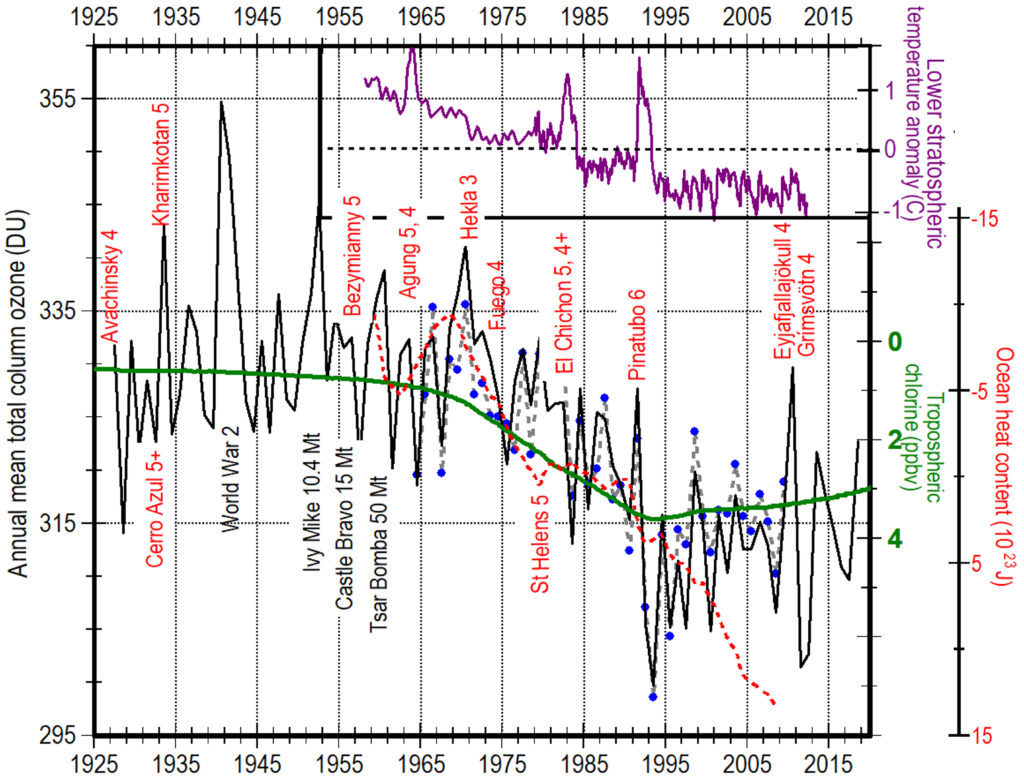
Annual mean total column ozone (O3, black line, y-axis inverted) fell rapidly from 1971 to 1995 and has been recovering slowly until volcanic eruptions in 2010 and 2011 (Staehelin et al., 1998). A slight delay after changes in tropospheric chlorine concentration is expected to give time for chlorine to move to high latitudes where the highest concentrations of ozone and the greatest depletion of ozone occur during winter Ozone Distribution.
The primary time delay in the atmospheric system involves the heat capacity of the ocean covering 71% of Earth. The observation that air temperatures above the ocean surface rose ~5 years after the decrease in ozone is in the range of calculations for a 3.5-year e-folding time for warming the ocean if the equilibrium temperature of Earth suddenly increased a small amount and a 10-year e-folding time taking into account an ocean with a 100-meter-thick mixed layer (Hansen et al., 1985).
Temperatures in the lower stratosphere (purple line, left) decreased ~1.5oC from 1958 to 1997 and have remained relatively constant since then. “Ozone depletion is believed to have caused the preponderance of the cooling in the lower stratosphere (15-25 km) altitude” but current models substantially underestimate the amplitude of this cooling and have trouble simulating the observed changes associated with volcanic eruptions in 1963, 1982, and 1991 (Thompson et al., 2012).
World ocean heat content (OHC, dashed purple line, top right image) increased from 1969 to 1980, remained relatively constant until 1990, and has been increasing ever since (Levitus et al., 2012). The time relationship between ocean heat content, volcanism, and annual total ozone is shown more clearly by the dashed red line left where the ozone data have not been smoothed. The slow change in ocean heat content between 1980 and 1990, smoothed with a 5-year running mean, reflects the observed global cooling of up to 0.6oC for up to three years following the eruptions of El Chichón (1982) and Pinatubo/ Cerro Hudson (1991) (Domingues et al., 2008). Continued rise of ocean heat content since 1998, when temperatures leveled off, suggests that ocean heat content may be driven more by increased ultraviolet energy due to ozone depletion than by temperatures in the lowermost troposphere. In the last decade, about 30% of ocean warming has been below 700 meters (Balmaseda et al., 2013).
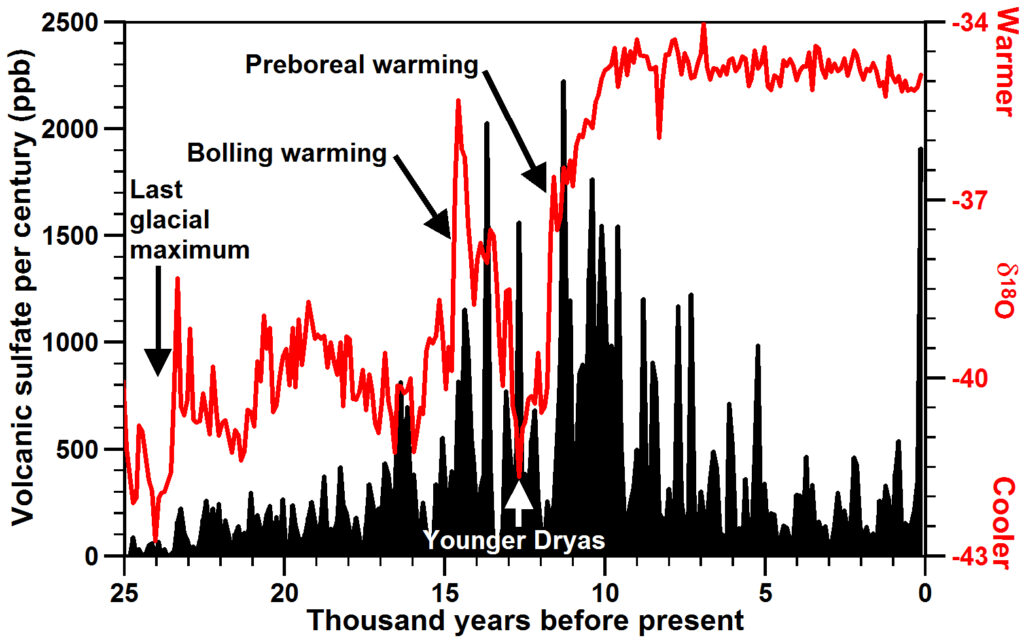
Sulfur dioxide (SO2) emissions (dotted black line, top image), 88% from burning fossil fuels, rose rapidly from 1950 until 1973 when concern over acid rain led to the addition of smokestack-scrubbers and other emission controls, as well as substitution of North Sea oil for coal in Europe (Smith et al., 2011) (Klimont et al., 2013). The result was a 20% decrease in SO2 emissions by 2002. Anthropogenic SO2 emissions, primarily from northern Russia, Europe, United States, and southern Canada, led to the large deposits in ice cores in Greenland at time 0 (20th century) of what is labeled volcanic sulfate in the figure to the right. Between 2000 and 2008, emissions of SO2 from China and India increased ~60% (Neely et al., 2013) but the 4 to 10% per year increase in stratospheric sulfate aerosols between 2000 and 2010 appears caused by small volcanic eruptions and not anthropogenic SO2 (Neely et al., 2013).
In the top right figure, the increase in atmospheric concentrations of carbon dioxide (CO2) (blue line) (NOAA, 2013) appears more closely related to the increase in ocean heat content (OHC, dotted purple line) than to an increase in surface temperature anomaly (red line). The rate of increase in (NOAA, 2014) temperatures nearly fell to zero in 1998 from ~0.27oC per decade between 1985 and 1998 to 0.07±0.7oC per decade between 1999 and 2008 (Knight et al., 2009, S22-S23) while CO2 concentrations continued to increase at the same or slightly higher rate. The annual rate of increase in concentrations of CO2 was <0.1 ppm/yr from 1938 to 1947 but began increasing to 0.7 ppm/yr by 1960 as concentrations of CO2 were rapidly increasing. From 1976, however, by the time ocean heat content had begun increasing, the annual rate of increase of CO2 doubled and even quadrupled to between 1.3 and 2.7 ppm/yr. Annual concentrations of CO2 have increased every year since 1959 but the rate of increase dropped from 1.3 ppm/yr in 1990 to 0.7 in 1992 when global temperatures dropped and the increase in ocean heat content slowed following the eruption of Pinatubo in 1991 even though CO2 was the second most voluminous gas erupted after water vapor. Similar but smaller changes were observed associated with the 10-times smaller eruptions of Agung in 1963 and El Chichón in 1982. These observations suggest that the strong correlation between atmospheric temperatures and SO2 concentrations going into and coming out of ice-age conditions (Petit et al., 1999) (Siegenthaler et al., 2005) (Lüthi et al., 2008) may primarily reflect the increase in solubility of CO2 in a cooling ocean. From this perspective, CO2 may be more a proxy for ocean temperature than a cause of increases in atmospheric temperatures.
The most surprising observation is that SO2 emissions increased ~30 years before temperatures increased. There is little physical basis for explaining such a long time delay, so we might wonder whether SO2 at concentrations of <50 ppbv (EPA, 2013) (Cao et al., 2009) has any substantial effect on atmospheric temperatures. Studies related to the eruption of Pinatubo show that SO2 injected into the stratosphere at concentrations in excess of 300 ppbm forms aerosols whose particle sizes grow large enough over months to reflect sunlight and cool Earth (Self et al., 1996). Substantial amounts of SO2 in the more turbulent troposphere are not rapidly oxidized, traveling more than half way around Earth in 8 to 12 days (Fiedler et al., 2009), and any aerosol formed in the troposphere has trouble growing to large enough particle sizes to scatter sunlight substantially.
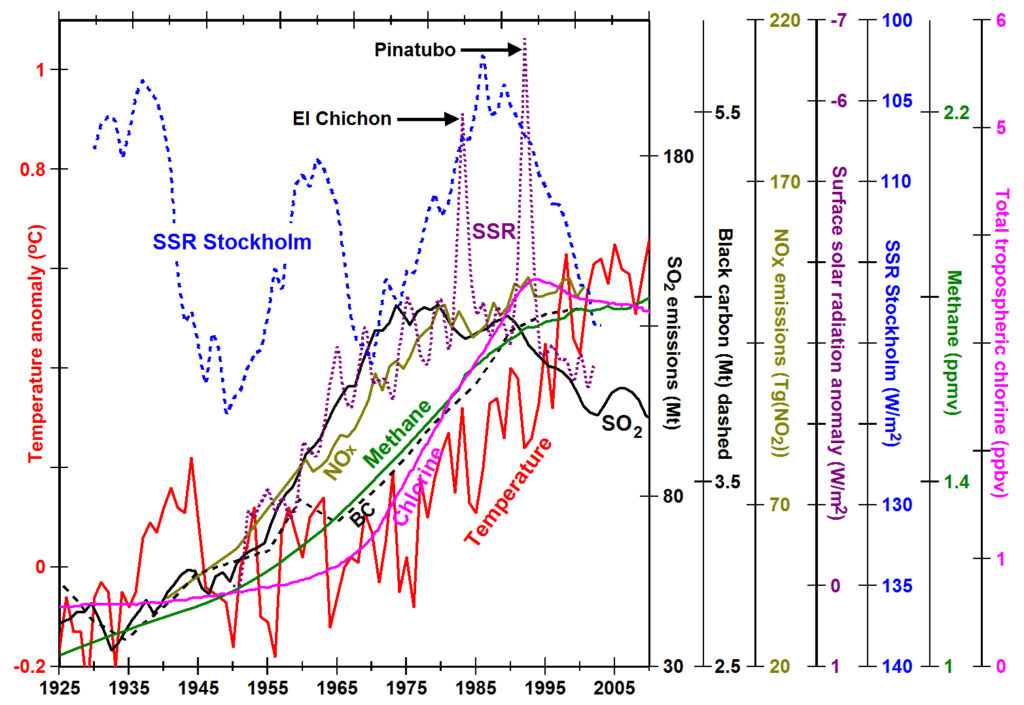
Concentrations of other pollutants also increased ~30 years before warming. Nitrogen oxide (NOX) emissions (olive line), 58% from vehicles and 34% from fossil fuels (EPA, 2012), show a trend similar to SO2 but with a slower decrease in vehicle pollution. Black carbon emissions (dashed black line) (Bond et al., 2007), the product of incomplete combustion, began increasing at rates similar to SO2, dropped precipitously with improvements in diesel-engine design, first applied in this accounting in 1965 (Novakov, 2003), and leveled off by 2000 as emissions decreased in the West but increased in Asia.
Methane concentrations (green line) (Etheridge et al., 1998) (Dlugokencky et al., 2008) increased gradually with emissions of other pollutants, reached a relatively constant rate of increase of ~14 ppb/year from 1955 to 1992, stopped increasing by 2006 and began increasing again at a rate of ~6 ppb/year in 2007 (Etheridge et al., 1998). The lifetime of methane is ~12 years, partially explaining the time lag. Methane concentrations are increased by fossil fuel use (Aydin et al., 2011), biomass burning, certain types of agriculture (Kai et al., 2011), and thawing of permafrost. Methane is removed from the atmosphere when oxidized by the hydroxide radical (OH). Observed changes in OH concentrations may explain much of the observed changes in methane.
OH concentrations increase with increasing NOX, tropospheric O3, and sunlight, and decrease with increasing SO2, carbon monoxide (CO), methane, and other pollutants it oxidizes. “A major pathway for production of OH radicals is the photolysis of ozone by solar UV-B ” so that concentrations of OH increase with increasing frequency of photolysis (Rohrer and Berresheim, 2006). OH radicals react with tropospheric trace constituents typically within one second, making global concentrations of OH very difficult to observe and model, but modeling suggests they have decreased 9% since pre-industrial times (Wang and Jacob, 1998). Formaldehyde (CH2O) data from Greenland suggest OH concentrations may have decreased by as much as 30% (Staffelbach et al., 1991). Detailed observations show a gradual decrease from 1980 to 2000 (Bousquet et al., 2005).
Carbon monoxide (CO) in the northern hemisphere increased 0.85%/year from 1950 to 1987 (Zander et al., 1989), decreased very slightly from 1988 (when detailed measurements began) to 2001, and increased slightly to 2005 (Duncan et al., 2007).
Concentrations of water vapor and ozone in the lowermost stratosphere increased until 2000 but began decreasing suddenly in 2001 (Randel et al., 2006) (Solomon et al., 2010) when emissions of SO2 stopped declining and began to increase again.
Tree ring density and thickness normally increase with temperature, but since the 1940s, they have decreased in northern forests while temperatures increased (D’Arrigo et al., 2008). SO2 is well-known to stress and even kill trees (Keller, 1984) (Manninen and Huttunen, 2000). When anthropogenic SO2 levels began to decline in the early 1980s, wide-spread greening in northern regions was observed from satellites (Nemani et al., 2003).
All of these direct observations suggest that rapid increases in anthropogenic pollution since World War II do not appear to have the immediate influence on global temperatures implied by current computer-codes calculating the exchange of energy from radiation to matter and visa versa. All observations have been plotted on the same x-axis time scale with the y-axis adjusted so that both the mean values before 1965 and the peak values since 1998 are more or less lined up. Ultimately these data will need to be modeled to determine the quantitative interrelationships, but first current models need to be improved substantially to address the issues with radiation codes, with ozone, and with volcanoes described on this website.
The purple dotted line (y-axis reversed) shows simulated annual clear-sky surface solar radiation (SSR) anomalies for mid-latitudes in the northern hemisphere calculated via current theory (Wild, 2009). The models predict that SSR decreased with increasing SO2 and related pollution and increased with decreasing pollution. Note the rapid decreases in SSR for ~3 years following the large volcanic eruptions of El Chichón and Pinatubo. The blue dotted line (y-axis reversed), on the other hand, shows annual mean surface solar radiation observed at Stockholm (Wild, 2009). While SSR is likely to vary with regional differences in pollution, there is little similarity between long-term changes in theoretical and observed SSR especially prior to 1970. The radiation codes currently used by all models do not appear to be accurate.
Trends of the physical properties and chemical compositions of the atmosphere since 1925 suggest that increases in pollutants and greenhouse gases do not appear to influence global warming as much as ozone depletion does.