Ozone Depletion, Record Warming, and Drought in 2012 and 2013
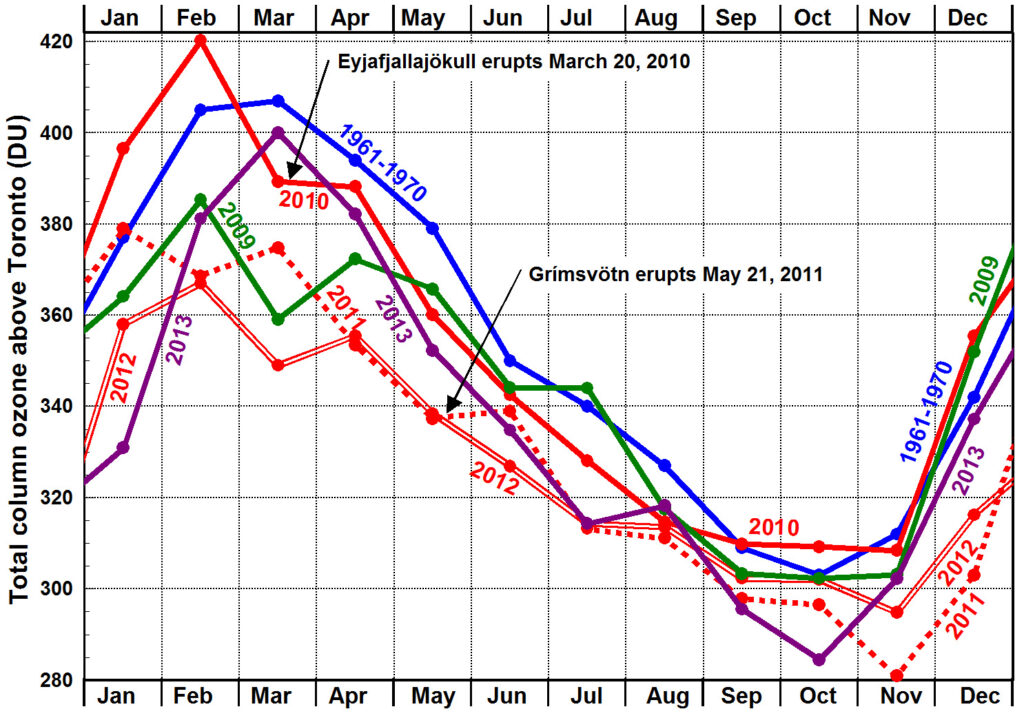
The blue line (right) shows the average monthly total column ozone measured above Toronto, Canada, averaged for the years 1961 through 1970 when anthropogenic tropospheric chlorine had only increased 16% from levels in 1925 towards peak levels in 1993. The green line shows average monthly column ozone for 2009 when anthropogenic chlorine had decreased 9% from its peak value. Note that ozone depletion is greatest between December and May, the months of greatest warming throughout the northern hemisphere (Trenberth et al., 2007). The mean change in radiative forcing between the 1960s and 2009 caused by ozone depletion should be directly proportional to the area between the blue and green lines.
The solid red line includes both the increase in ozone during February preceding the first eruption of Eyjafjallajökull in March 2010, discussed in Pre-eruption Ozone , and subsequent depletion. The dashed red line shows total ozone in 2011 including depletion due to Eyjafjallajökull and increases and decreases related to the eruption of Grímsvötn. The double red line shows ozone levels in 2012; the purple line for 2013. Note that from November 2011 through February 2012, the times when monthly maximum temperature records have been set throughout central North America (NOAA, 2012), ozone has been depleted by as much as 14% below mean values in the 1960s.
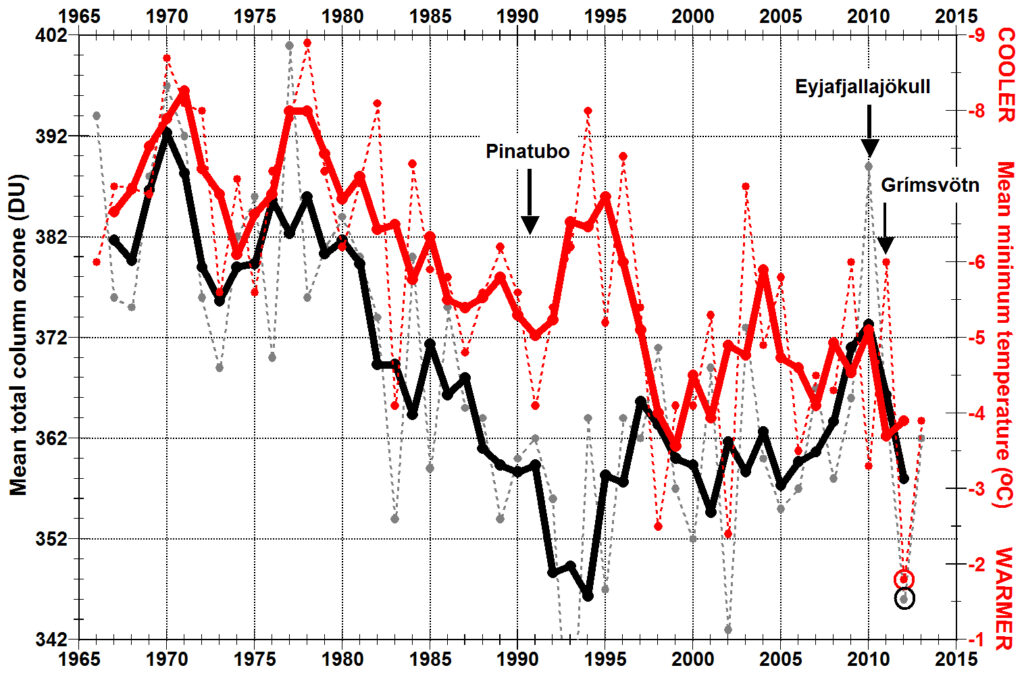
The dashed black line (left) shows the average for each year of the monthly mean total column ozone above Toronto averaged over five consecutive months from December through April; the dashed red line (y-axis inverted) shows the same average for monthly mean minimum temperatures. The solid lines are the same data smoothed using a 3-month symmetric running mean. A substantial decrease in ozone is typically but not always associated with an increase in minimum temperature except in 1992 to 1995 when aerosols in the lower stratosphere following the June 1991 eruption of Pinatubo decreased radiation from Sun as much as 2.7±1.0 W m-2 during August and September (Minnis et al., 1993) decaying exponentially to negligible values by 1995. Note the extremely low ozone and high temperature in early 2012 (circled data points, lower right part of the image).
These data suggest that depletion of ozone due to the eruptions of Eyjafjallajökull in 2010 and Grímsvötn in 2011 supplemented anthropogenic depletion leading to extreme ozone depletion and to extreme warm temperatures and drought observed throughout the Great Plains of North America during late 2011 and 2012 (Karl et al., 2012) and to the highest sea surface temperatures ever recorded on the continental shelf off the northeastern United States during the first half of 2012 (NOAA, 2012) (Sallenger Jr et al., 2012). A warmer North Atlantic Ocean is easier to evaporate, most likely leading to increased preciptiation and major floods in Great Britain and Ireland and elsewhere in Europe during 2012 and 2013.
On July 12, 2012, there was an extreme melt event across 98.6% of the Greenland ice sheet (Nghiem et al., 2012). Such melt events at high elevations in Greenland are extremely rare, last seen in 1889 and before that around 1200 (Clausen et al., 1988, pdf) (Meese et al., 1994). The 1889 melting was coincident with a major El Niño (Chen et al., 2004) and the onset of major drought in 1889 from Mexico to Saskatchewan (Herweijer et al., 2007). These events followed the 1883 eruption of Krakatau (VEI 6), the 1886 eruption of Okataina (VEI 5), and several VEI 4 eruptions. These observations raise the possibility that the major El Niño in 1998 and associated warming might have been related to major ozone depletion following the eruptions of Pinatubo (VEI 6) and Cerro Hudson (VEI 5+) in 1991 after the cooling effects of the stratospheric aerosol had ended and compounded by three VEI 4 eruptions between 1992 and 1994.
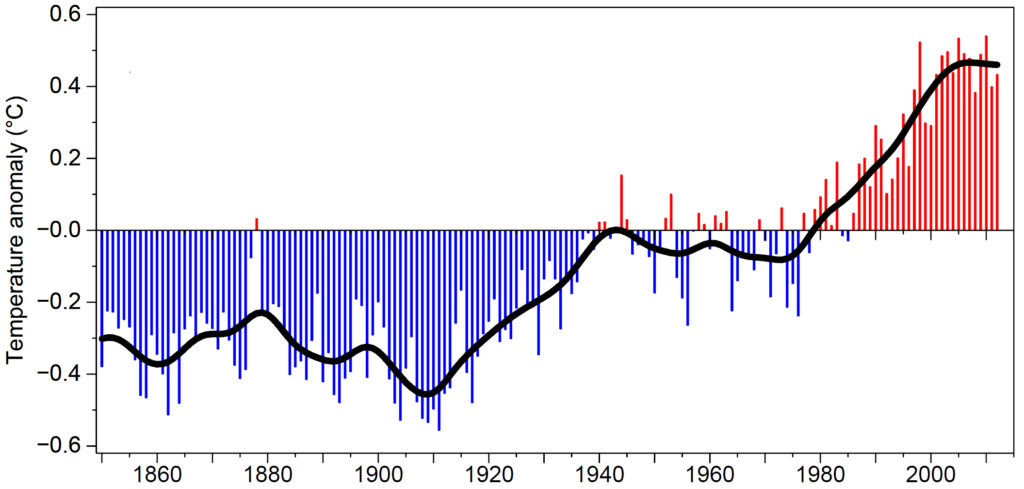
The drought of 2012 approached the intensity of the great Dust Bowl droughts of 1934 and 1936 (Brönnimann, 2009) when a highly unusual sequence of seven VEI 4 and 5 eruptions occurred from 1931 through 1933 in Indonesia, Japan, Kurile Islands, Kamchatka, Alaska, Guatemala, and Chile (Global Volcanism Program, 2013), providing at least a partial explanation for the well-known warming of mean northern hemispheric surface temperatures during the 1930s followed by cooling in the 1940s (black line, right) (Jones, 2013).
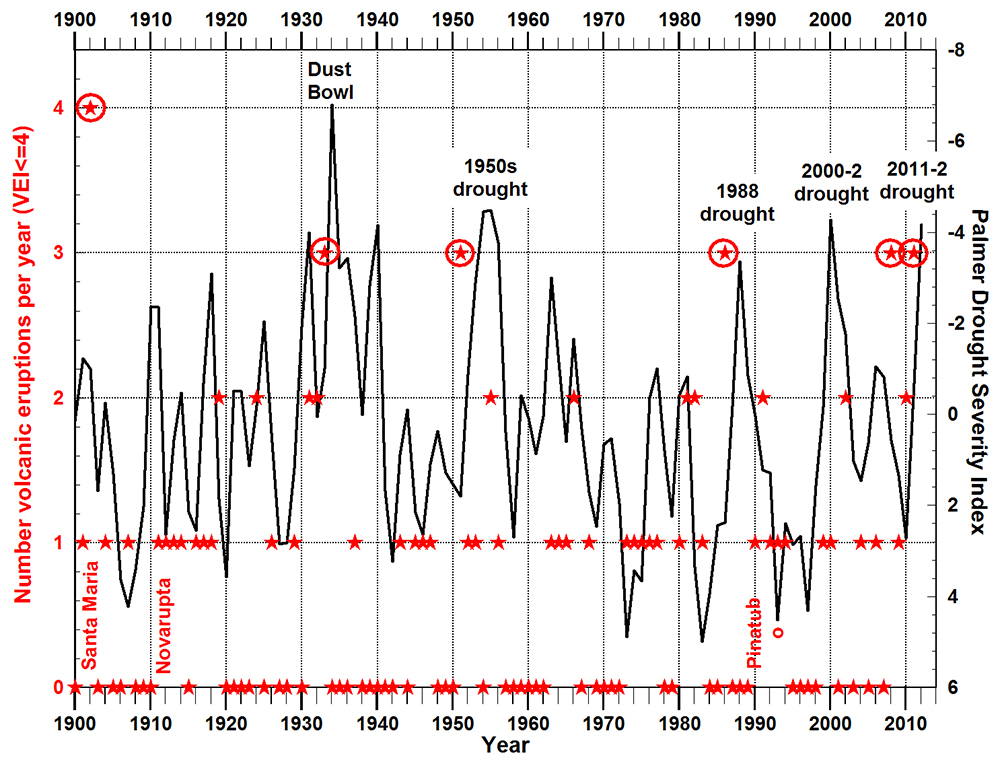
Four of the five most severe droughts within the continental United States follow years with 3 or more volcanic eruptions (circled red stars, left). The Palmer Drought Severity Index measures dryness based on recent temperature and precipitation and is reported regularly by NOAA. Volcanic eruption data are from the Large Magnitude Explosive Volcanic Eruptions database (Crosweller et al., 2012). Click on the figure for more detail.
It is conceivable that recent warming and drought were enhanced by the fact that November 2011 had the largest number of sunspots per month since October 2002 (NASA, 2013), and ultraviolet insolation increases four to six times more than broadband irradiance during solar cycles (Haigh et al., 2010). But in 1933 and 1934, the numbers of sunspots per month were relatively low until late in 1936.
These possible interrelationships before 2010 will need much more detailed study, but substantial depletion of ozone during 2011 through 2013 in mid-to-polar latitudes over North America does appear to be contemporaneous and co-located with both warming and drought in North America.