Changes at the Tropopause
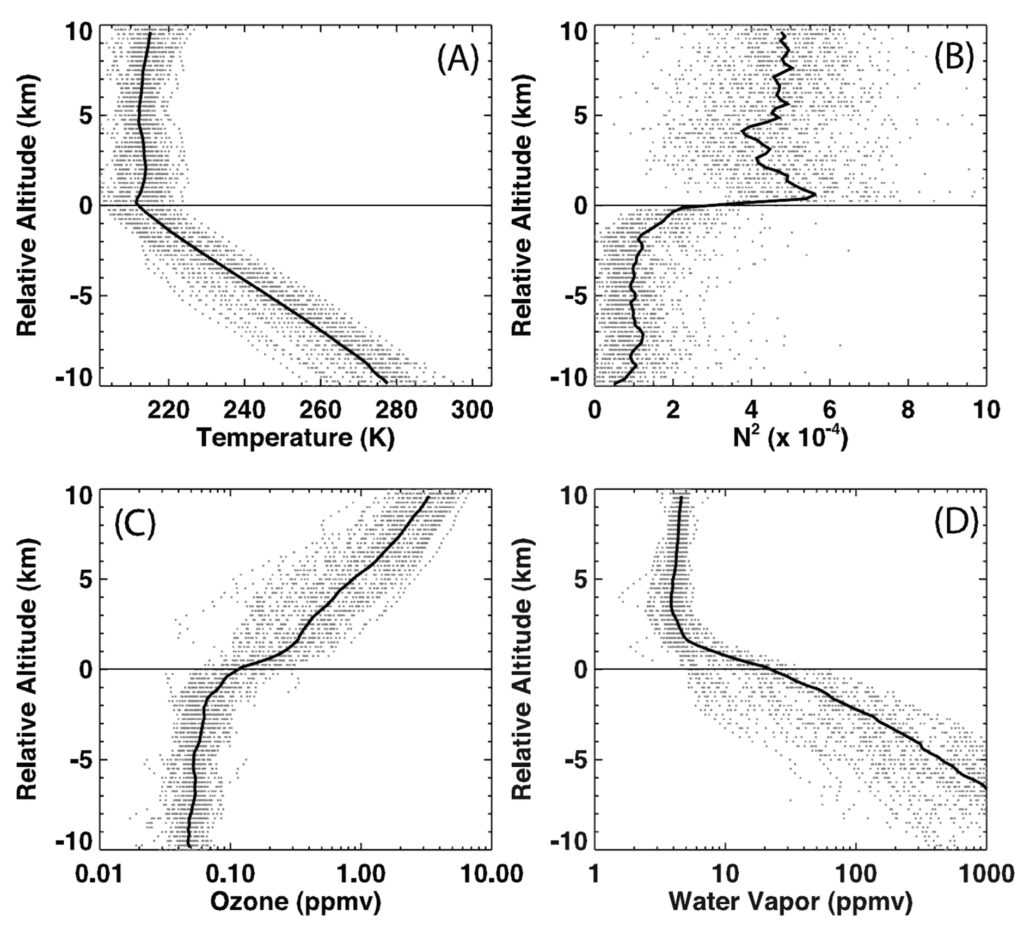
Forty-five profiles from individual balloon soundings over Boulder, Colorado (40°N, 105°W) during all months. Profile altitudes are referenced to the thermal tropopause (0). Individual measurements are shown as gray dots, and mean is shown as a black line. (A) Temperature, (B) static stability (N2), (C) ozone, and (D) water vapor. (Figure 3 in Gettelman et al. (2011). Static stability is represented by the square of the Brunt‐Väisälä frequency , N2.