Explosive Volcanism Appears to Increment the World Into Ice Ages
The ocean, covering 71% of Earth’s surface, provides the largest heat capacity of the climate system. A mere 3.2 meters of ocean holds as much heat as the whole atmosphere yet the average depth of the ocean is 3800 meters (Elert, 2012), a factor of nearly 1200 times. The only way to move the earth into an ice age is to reduce the massive amount of heat stored in the ocean.
Cooling the earth approximately 0.5oC for several years has been observed after all large volcanic eruptions throughout history (Griggs, 1922)(Kelly and Sear, 1984)(Angell and Korshover, 1985)(Handler, 1989)(de Silva and Zielinski, 1998)(Robock, 2000)(Stothers, 2000)(Zielinski, 2002)(Thordarson and Self, 2003)(Fei et al., 2007), has been successfully modeled (Ramachandran et al., 2000)(Hansen, 2002)(Ammann and Naveau, 2003)(Meehl et al., 2004)(Shindell et al., 2004)(Timmreck and Graf, 2006), is discussed clearly by the IPCC (IPCC, 2007), and is described in Volcanoes and Climate.
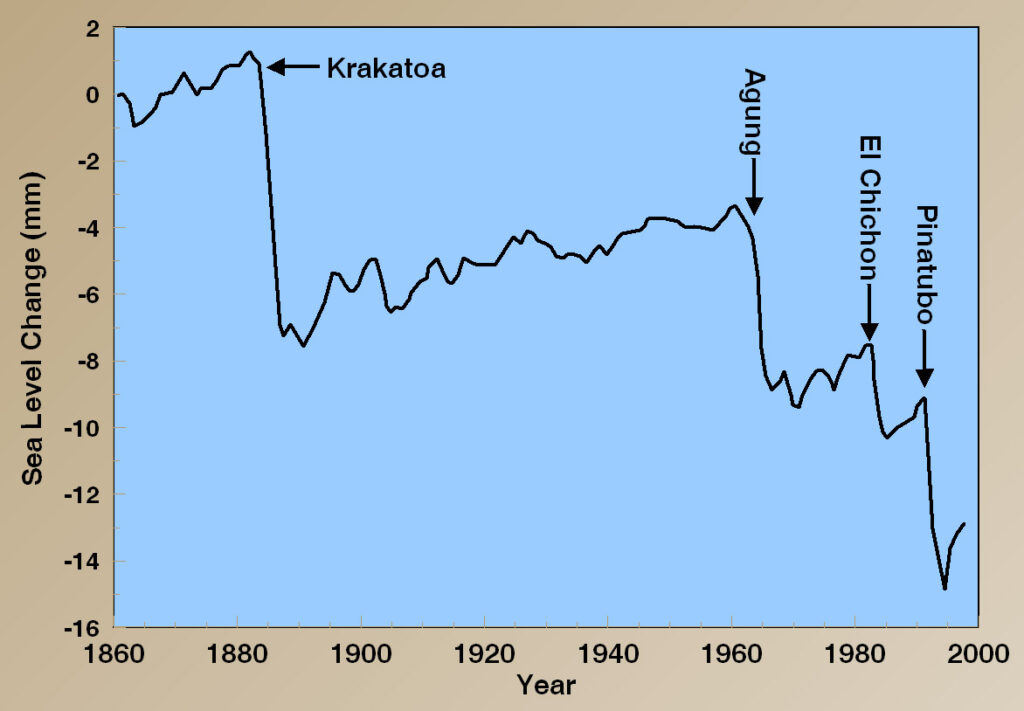
Church et al. (2005) estimate that the eruption of Pinatubo caused a rapid “reduction in ocean heat content of about 3×10²² J [Joules] and a global sea-level fall of about 5 mm [millimeters]” and that “recovery was not complete at the end of the simulations in 2000,” 8.5 years later.
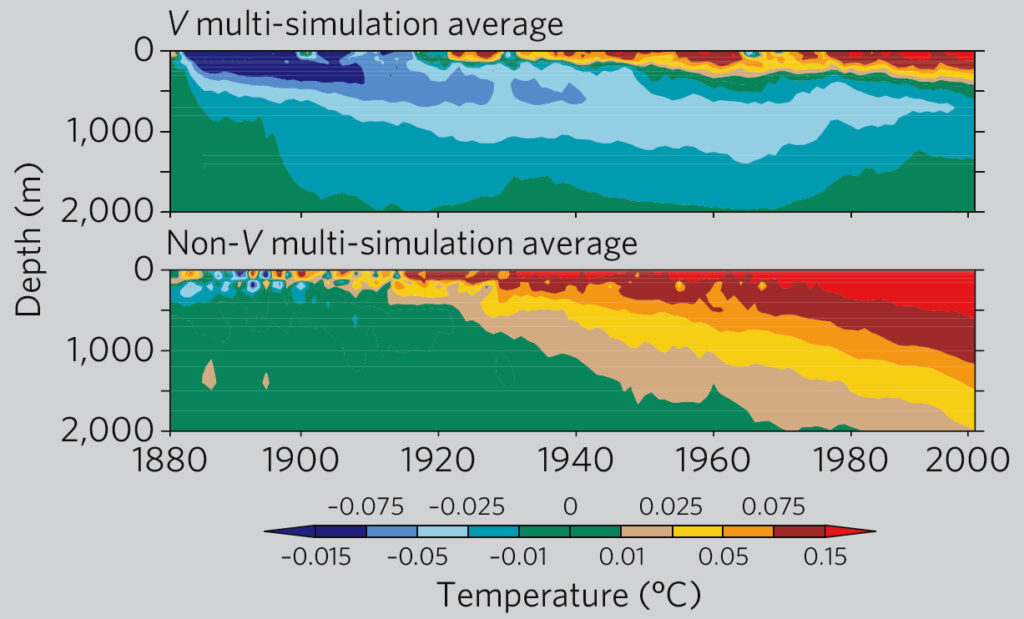
Gleckler et al. (2006a) and Gleckler et al. (2006b) conclude from modeling (upper right) that global cooling for several years following the eruption of Krakatoa in 1883 decreased temperatures in the upper two kilometers of oceans for decades. Gregory et al. (2006) found from modeling the change in sea level caused by a cooling ocean that such cooling can accumulate (right). Thus large explosive eruptions occurring every decade or so, compared to only one during the past hundred years (Mt. Pinatubo, 1991 preceded by Mt. Katmai, 1912), can potentially increment the world into an ice age (Ward, 2009). The number of layers of ash per thousand years from these types of volcanoes observed in marine cores off the west coast of Central America and throughout the Pacific (Kutterolf et al., 2012) are far more numerous during glacial periods than during interglacials.
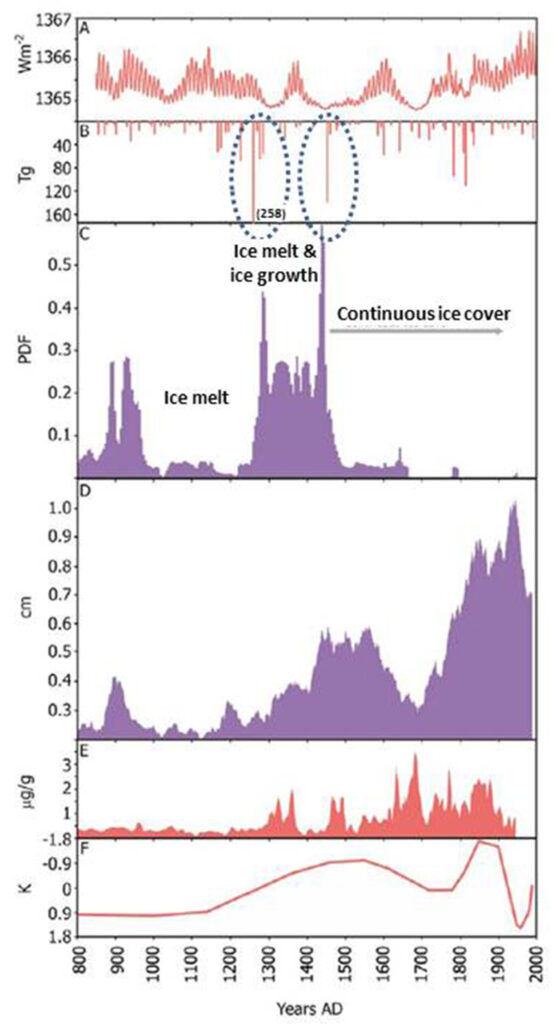
Miller et al. (2012) argue (left) that the onset of the Little Ice Age between 1275 and 1300 AD “can be linked to an unusual 50-year-long episode with four large sulfur-rich explosive eruptions” as can the intensification of the Little Ice Age between 1430 and 1455 AD.
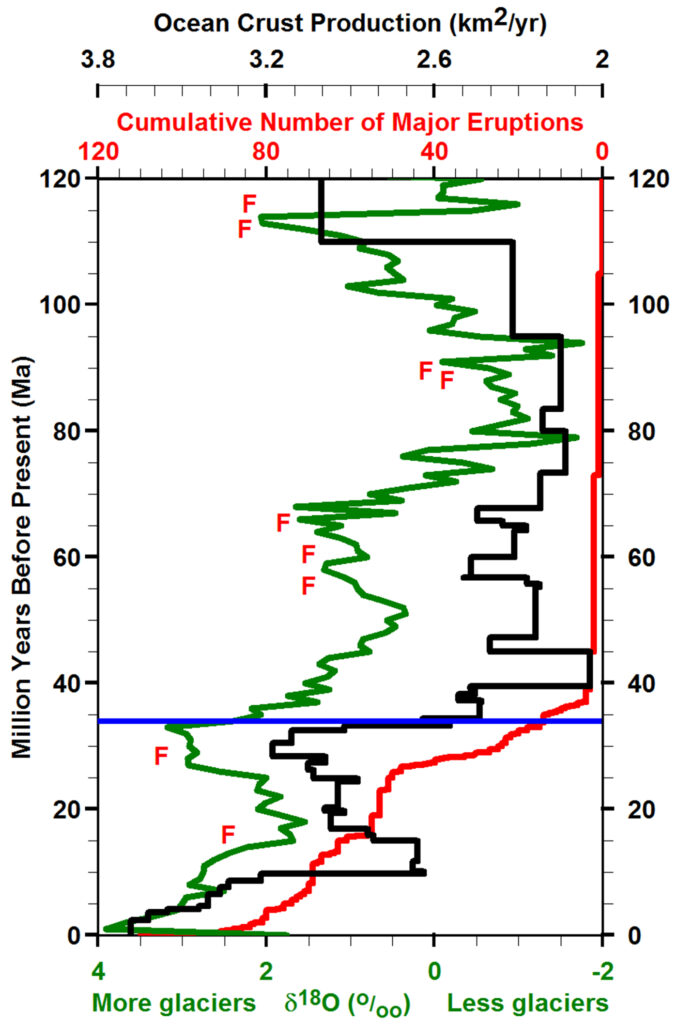
The most complete list available of all known large volcanic eruptions through the last 542 million years (Ma) is given in this Table (Excel version) (References). These events typically have a Volcano Explosivity Index (VEI) (Newhall and Self, 1982) (Siebert et al., 2010) of 6 or greater. The red line to the right shows the cumulative number of the largest known volcanic eruptions in the past 120 Ma. The general shape of this curve is what is most important and is probably a reasonable estimate. The actual number of largest eruptions is a major underestimate. For example, more than 50% of the eruptions shown are within the United States portion of the largest known large rhyolitic province extending from central Colorado to central Mexico and active primarily between 32 and 27 Ma (million years before present) as described in detail by (Ward, 1991) (Ward, 1995). Yet more than 75% of this province is in Mexico where insufficient fieldwork has been done to delineate the date and volume of most specific eruptions (McDowell and Clabaugh, 1979). Thus the major increase in number of large eruptions between 32 and 27 Ma could be 4 times greater than shown.
Despite these limitations, there is clearly a significant increase in the rate of large volcanic eruptions between 37 and 27 Ma, between 17 and 10 Ma, and since 5 Ma. Around 33.9 Ma (blue line), major cooling of the earth occurred in two 40,000-year phases separated by 200,000 years, leading to sudden major glaciation in Antarctica (Coxall et al., 2005). At the same time the temperature in central North America decreased by 8.2°C (Zanazzi et al., 2007) and abrupt cooling was observed in China (Dupont-Nivet et al., 2007). There were dramatic changes toward colder climate in flora and fauna in North America and Eurasia (Kerr, 1992) (Prothero and Emry, 1996). Major increases in ice volume in Antarctica also began at 23.7, 16–12, and 2.7 Ma (Zachos et al., 2005) (Flower, 1999). Extensive ice-rafted debris (IRD) appeared in the Norwegian–Greenland Sea between 38 and 30 Ma (Eldrett et al., 2007). Other major increases in glaciation in the Arctic began around 14 and 3.2 Ma (Moran et al., 2006).
The green line is an estimate of the mean paleotropical sea-surface temperature based on δ18O, which is the ratio of oxygen isotopes 18O to 16O measured in the shells of foraminifera and compared to some standard (Veizer et al., 1999). Increasing δ18O is sensitive to decreasing temperature and to increasing world ice volume and is therefore a good proxy for the amount of glaciation. Individual measurements were averaged for each period of one million years. Independent calibration of δ18O for temperature using the ratio of magnesium to calcium suggests a difference of 2.8±0.7oC between the Last Glacial Maximum and the present (Lea et al., 2000). Therefore the range shown may be as much as 7oC with the coldest temperatures to the left. Clearly, cooling increased most around 33.9 Ma and since 15 Ma when the rate of major volcanic eruptions was high.
The black line shows the ocean crust production per year (Cogne et al., 2006). The rate of ocean crust formation similarly is higher for periods of rapid cooling. One might assume that submarine volcanoes would heat the ocean, but for new ocean floor to form, similar amounts of ocean floor must be subducted elsewhere around the globe. Increased subduction leads to increased volcanic activity in the atmosphere above subduction zones. Such eruptions are largely unreported in the Table before 5 Ma because of the difficulty of mapping their deposits under piles of more recent volcanic debris. The rapid increase of ocean crust production around 40 Ma, 33 Ma and 10 Ma are contemporaneous with global cooling. The net cooling after major volcanic eruptions demonstrates that the reduction of incoming solar heat caused by volcanic atmospheric aerosols is considerably greater than the heat released directly by subaerial or submarine volcanoes.
Starting after 4 Ma, the world began slipping into the coldest part of the ice age. Ice Rafted Debris (IRD) were first observed in the North Atlantic around 3 Ma (Shackleton et al., 1984) as forests in Africa turned into open savannah (Behrensmeyer, 2006) (Wynn, 2004). At 2.65 Ma there were major increases of IRDs and deep-sea volcanic sediments in the North Pacific (Prueher and Rea, 1998) (Prueher and Rea, 2001) marking the beginning of the Pleistocene ice age preferred by climatologists (2.58 Ma). Geologists think of the Pleistocene as starting at 1.81 Ma (Gradstein et al., 2006). This increase in volcanism correlates with the major increase in the rate of subduction under Alaska and Asia.
The red Fs (above, right) show times of major flood basalts listed in the Table. The dates of individual flood basalt eruptions are unknown and are not included in the red curve. As is discussed in Volcanoes and Climate, major flood basalts normally cause major short-term global warming for periods of less than one million years. Such warmings have largely been averaged out of the green curve, which shows one mean value per million years.
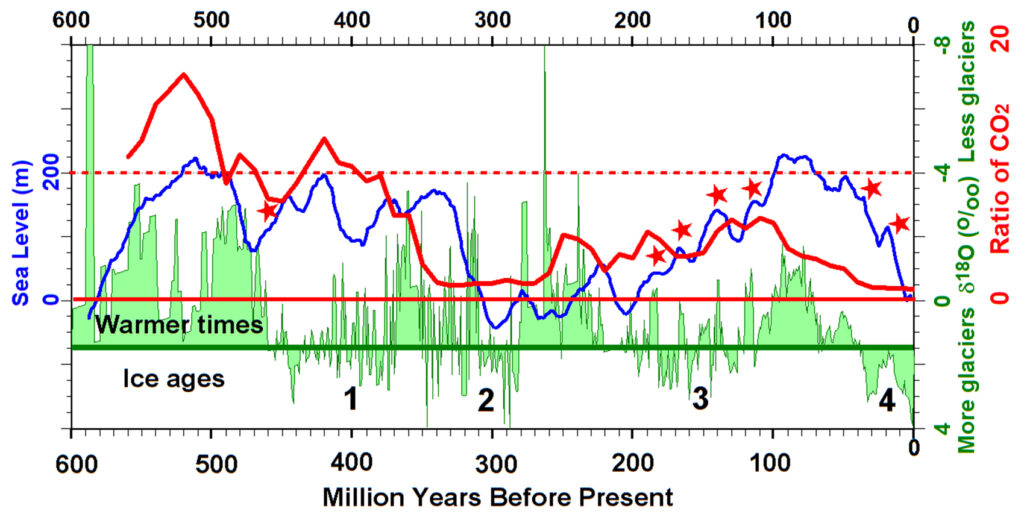
The same paleotropical sea-surface temperature data are shown by the shaded green curve (left) for the past 600 million years. Data below the green horizontal axis (δ18O per m.y.=1.45‰ [per mil]) represent times of extensive glaciation during ice ages and data above this axis represent warmer times of limited glaciation. Note the four numbered basic epochs of glaciation. Times of these epochs and the specific times of major glaciation shown agree with detailed geologic evidence for glaciation throughout the world within the temporal resolution of both data sets (Crowell, 1999) (Frakes et al., 2005). Note that most major large rhyolitic provinces (red stars) (also listed in the Table) occur near the onset of major glaciation and that the largest known occurs at 32 Ma beginning the largest known glacial epoch in the past 600 million years.
The blue curve shows sea-level (Haq et al., 1987) (Haq et al., 1988) (Haq and Schutter, 2008) (Ross et al., 2007) (Sea-level curve) (Miller et al., 2005). Note that the large rhyolitic provinces (red stars), as far back as they have been mapped, typically occur at the onset of decreases in sea-level most likely associated with increased glaciation.
The red curve shows the ratio of the atmospheric concentration of CO2 to current concentrations based on a detailed model for the weathering of volcanic and other rocks (Berner, 2006a) (Berner, 2006b) (Data). Note that CO2 concentrations were as much as 13 times current during glacial epoch 1 and as much as 6 times current during glacial epoch 3.
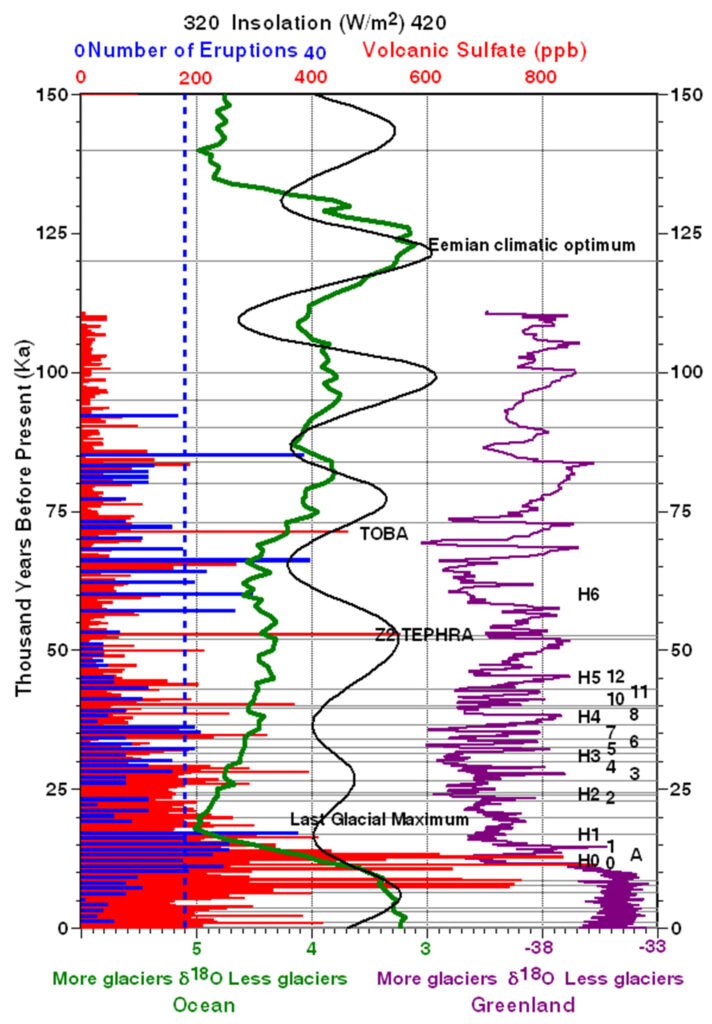
The figure (right) shows the relationship of volcanism to global temperature over the past 150,000 years (Ka). The green line shows stacked δ18O data measured in the shells of foraminifera from 57 globally distributed benthic sites (Lisiecki and Raymo, 2005). Note that it took 100,000 years to cool the earth incrementally but less than 9000 years to warm it up again. Why?
In 1920, Milanković first published an explanation for ice ages that has been the only widely accepted mechanism (Hays et al., 1976). He noted that the amount of solar energy reaching the earth is controlled primarily by periodic changes in the earth’s precession, obliquity, and eccentricity and proposed that the net effect could explain the origin and termination of ice ages. The insolation in August at 65oN predicted by Milanković is shown in black curve (Laskar et al., 2004) (Data). The long period components of the green curve (global temperature over the past 150,000 years based on δ18O) are similar to the black curve implying Milanković cycles play some role at periods greater than tens of thousands of years, but the temperature varies much more frequently and shows a much more direct relationship to volcanism.
The purple line shows δ18O measured in the GISP2 ice cores in Greenland (White et al., 1997) (Data, Stacked). Various data show that the surface temperature in Greenland cycles through a range of as much as 16oC (Huber et al., 2006) (Lang, 1999) with modest change of mean until the end of the ice ages while the green line suggests that ocean temperatures changed less than 3oC (Lea et al., 2000), ratcheting incrementally down into the depths of the ice age and then warming rapidly.
Major volcanic eruptions listed in the Table (horizontal black lines) typically occur at the beginning of sudden decreases in δ18O. The precision of the age dates for most of these eruptions is limited, but this temporal relationship is particularly clear for the few precisely dated eruptions (Sarna-Wojcicki et al., 2000) (Lanphere et al., 2002). The record of specific eruptions during this time period is fairly limited, but evidence in the latter part of the Table suggests there were enough major eruptions to have at least one occur for each and every inflection point along the δ18O curve.
The red bars show the concentrations of volcanic sulfate (SO42−) measured by ion chromatograph in specific layers in the GISP2 ice core (Zielinski et al., 1996) (Data, Volcanic markers). The amount of sulfate designated as volcanic is determined by an empirical orthogonal function (EOF) analysis on the entire glaciochemical time series (Mayewski et al., 1993) (Mayewski et al., 1997). The primary sources of sulfate are continental dust rich in calcium, sea salt rich in sodium, and volcanoes rich in a host of other elements. The EOF analysis essentially uses the proportions of all elements to separate sources.
Ice layers become more compacted and more difficult to decipher with increasing depth. The blue bars show the number of eruptions per century inferred by Zielinski et al. (1996) to correct for such compaction. Note that while most red bars before the Last Glacial Maximum correspond to cooling, some red bars and all blue bars longer than 18 eruptions per century (blue dashed line) occur during brief warming phases. Also note that the greatest levels of volcanic sulfate by a factor of 3 to 4 correspond to the period of most rapid warming after the Last Glacial Maximum.
H0 through H6 show Heinrich events when large numbers of icebergs suddenly appeared in the northern Atlantic Ocean (Hemming, 2004). Numbers 0 through 12 and the letter A are Dansgaard–Oeschger events when temperatures on Earth warmed suddenly within decades as explained in Abrupt Climate Change.
All of the data described on this web page suggest that large explosive volcanic eruptions occurring only decades apart tend to increment the world into an ice age while numerous effusive , basaltic, volcanic eruptions lasting for a thousand years appear sufficient to warm the Earth out of an ice age. Explosive eruptions reduce the heat content of the ocean, effusive eruptions increase it. There is a great deal of work needed to map out all the details including the study of non-explosive, regularly degassing volcanoes (Bureau et al., 2000), but the big picture is quite clear.
The greenhouse gas theory of climate change cannot provide any direct explanation for such sudden and regular changes in climate, especially prior to the burning of fossil fuels by humans. Volcanoes do erupt megatons of carbon dioxide, but this makes up a very small part of the global carbon cycle. Concentrations of carbon dioxide high up on Mauna Loa (NOAA, 2013) are actually observed to decrease after explosive eruptions most likely because of global cooling of the ocean surface. The atmospheric concentration of carbon dioxide appears to be a good proxy for ocean temperature much as a glass of cold soda loses carbon dioxide as it warms. This provides an explanation for why atmospheric concentrations of carbon dioxide are observed to decrease during glaciations and increase during interglacials (Fischer et al., 1999) (Monnin et al., 2001) (Caillon et al., 2003) (Siegenthaler et al., 2005).