Ozone Distribution in Earth's Atmosphere
| Gas | Volume |
|---|---|
| Nitrogen (N2) | 78.0790% |
| Oxygen (O2) | 20.9446% |
| Argon (Ar) | 0.9339% |
| Carbon dioxide (CO2) | 0.0397% |
| Neon (Ne) | 0.001818% |
| Helium (He) | 0.000524% |
| Methane (CH4) | 0.000179% |
| Krypton (Kr) | 0.000114% |
| Hydrogen (H2) | 0.000055% |
| Nitrous oxide (N2O) | 0.0000325% |
| Carbon monoxide (CO) | 0.0000100% |
| Xenon (Xe) | 0.0000090% |
| Ozone (O3) | <0.0000080% |
| Nitrogen dioxide (NO2) | 0.0000020% |
| Iodine (I2) | 0.0000010% |
| Ammonia (NH3) | trace |
| Not included in above dry atmosphere | |
| Water vapor (H2O) | ~0.25% by mass |
| Variation in water vapor | 0.001 to 5% |
Climate change results from changes in the chemical content of Earth’s atmosphere – changes that control the proportion of solar radiant energy absorbed by the atmosphere, the proportion absorbed by Earth, and the proportion of solar and terrestrial energy radiated or reflected back into space by the earth-atmosphere system. The concentrations of most chemical species do not change much except to decrease with altitude. Nitrogen, making up 78% of the volume of the atmosphere, absorbs solar energy causing ionization at wavelengths less than 170 nanometers (the Lyman-Birge-Hopfield bands). Essentially all available solar energy in these bands is absorbed above the mesopause (around 85 km). Oxygen, making up nearly 21% of the atmosphere, is ionized and photodissociated at wavelengths shorter than 242.4 nanometers (the Hopfield, Schumann-Runge, Herzberg bands). There is more than enough oxygen so that essentially all of this energy is absorbed above the tropopause. Argon, making up 1% of the atmosphere, is a monatomic noble gas that does not change.
Thus all chemical change in a dry troposphere involves only trace gases making up a mere 0.04% of the atmosphere. Most of these, including key greenhouse gases such as carbon dioxide and methane, are emitted from and absorbed by Earth’s surface, destroyed at higher altitudes in the atmosphere, have lifetimes measured in years, are therefore well-mixed, and typically change much less than 1% per year, with trends that last for years to decades.
Water vapor, on the other hand, contributes from 0.001% to 5% of all gases in a wet atmosphere and is not well mixed. Water vapor changes with time, altitude, latitude, and longitude depending of the availability of water to evaporate, the availability of solar energy to cause evaporation, and the availability of cold air to condense the vapor into precipitation. Water vapor is mostly concentrated near the ground, decreasing with altitude and temperature so that only trace amounts are typically found above the tropopause. One effect of increasing amounts of water vapor is to decrease the tropospheric lapse rate from 10oC towards 5.5oC per kilometer, effectively increasing the height of the tropopause. The mean tropospheric lapse rate is approximately 6.4oC per kilometer.
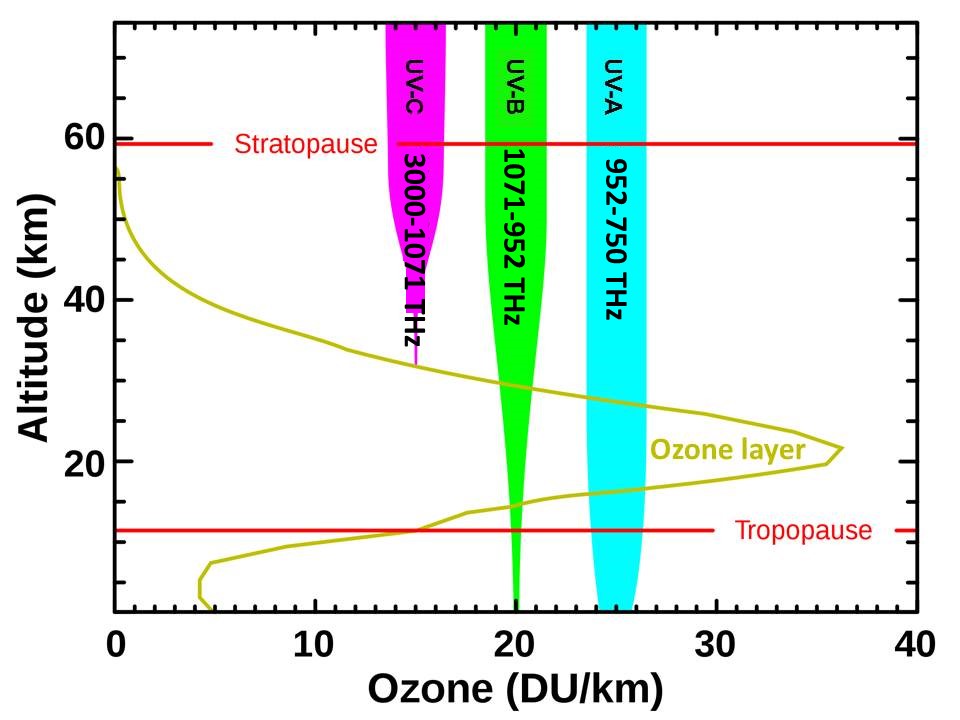
Ozone is the one gas that changes most regularly and most quickly over altitude, latitude, region, season, and time. Unlike most other gases, ozone is both formed and destroyed primarily in the lower stratosphere and uppermost troposphere. The first step in forming ozone is to photodissociate oxygen (O2) into two odd oxygens (O), converting high-energy solar radiation very efficiently into atmospheric temperature, which is proportional to the velocities (translational kinetic energies) of the separating atoms. An oxygen molecule (O2) and an odd oxygen atom (O) then combine to form ozone (O3), another exothermic chemical reaction. Finally, ozone is photodissociated back into O2 and O, converting more solar radiant energy efficiently into atmospheric temperature. Ozone is so reactive that it can take seconds to minutes for this cycle to occur when sufficient ultraviolet radiation is available. Thus observed concentrations of ozone result from these processes repeating over and over in the presence of sunlight, converting solar radiation to heat. Even though ozone makes up less than 8 x 10⁻⁶ % of the atmosphere, it has the primary effect on atmospheric temperatures. The fact that there is not enough ozone to absorb all of this high-energy solar radiation, means that changes in the amount of ozone are very effective in modulating how much of this high-frequency, short-wavelength energy reaches Earth.
Ozone concentrations can vary more than 20% within hours, more than 50% between seasons, and widely over broad geographic regions. Other gases, such as the hydroxyl radical (OH), that are formed from or interact chemically with ozone in the lower atmosphere may change in response to changes in ozone but these do not typically have as major effects on temperature.
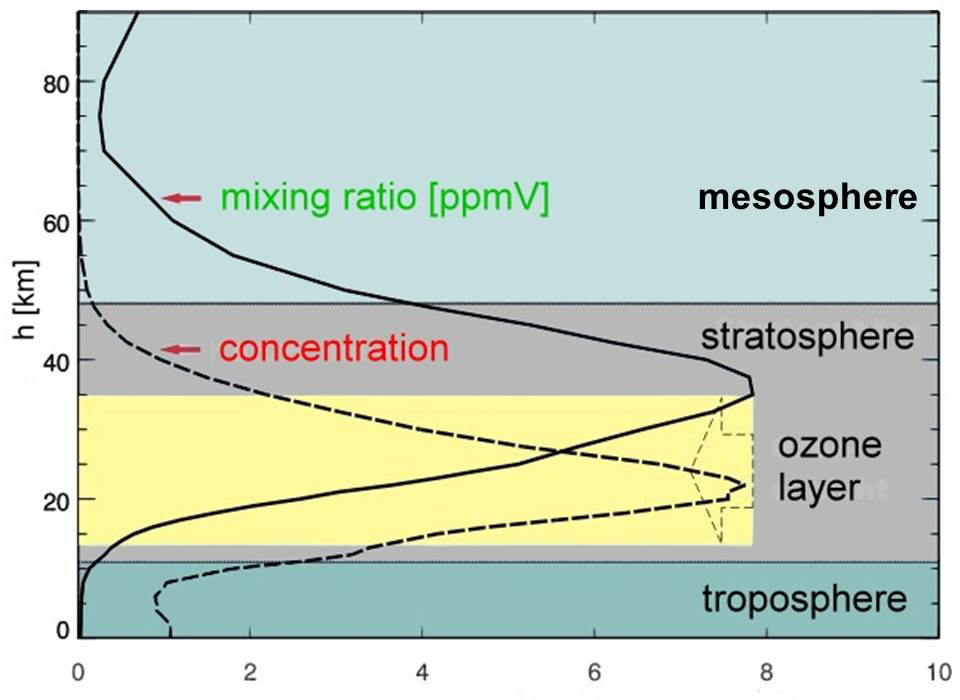
More than 90% of the ozone in the atmosphere resides above the tropopause (9 km in polar regions to 16.6 km in the tropics) with the higher mean concentrations in the ozone layer primarily between 20 and 30 kilometers (Fioletov, 2008). The highest concentrations of ozone are typically 9 to 10 kilometers above the tropopause.
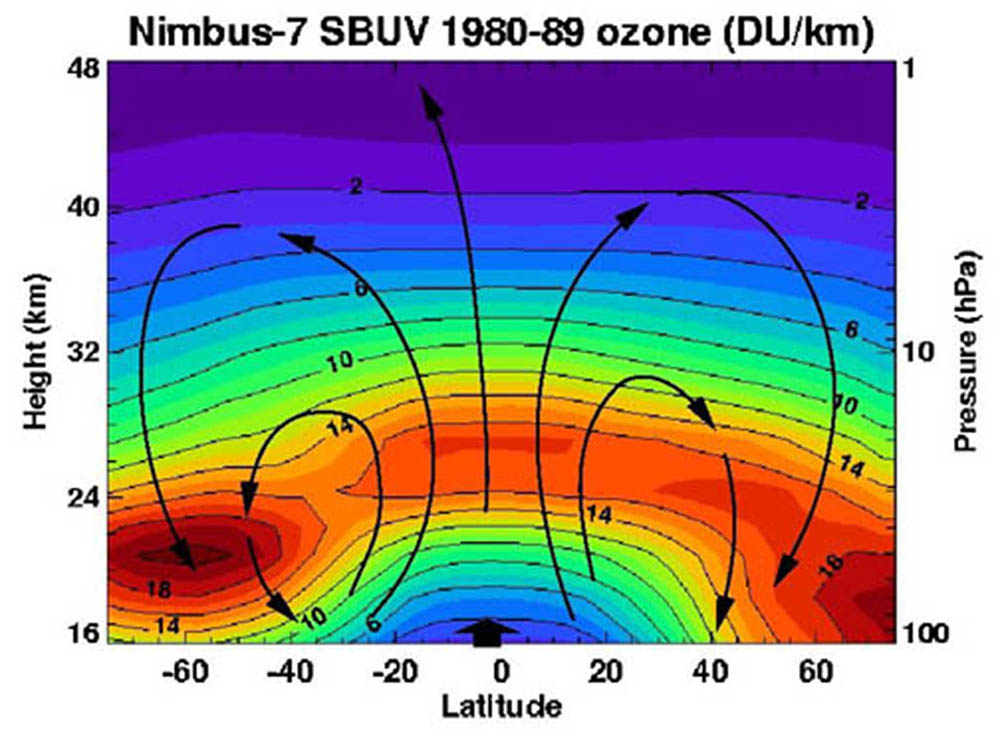
Brewer (1949) and Dobson et al. (1946) proposed that this variation of ozone with latitude might be explained by a slow current (black arrows, figure lower left) moving in the winter hemisphere. Thinking of the distribution of ozone as resulting from a circulation may not be completely accurate. The observed distribution of ozone may simply reflect the altitudes where the ozone cycle can exist and the fact that photodissociation of ozone decreases in winter polar regions due to less available sunlight, allowing ozone to accumulate. Of course the distribution of ozone with altitude and latitude may be affected by the Hadley, mid-latitude, and polar circulation cells driving atmospheric circulation, but the lifetime of ozone is very short.
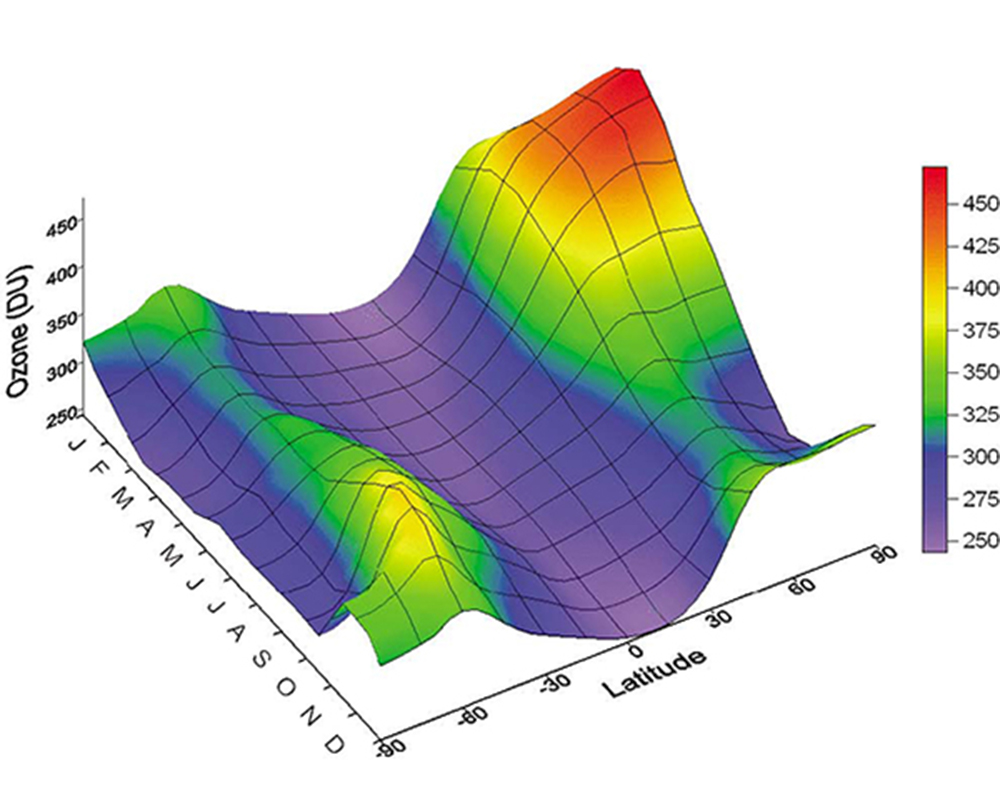
The ozone layer also changes with the seasons, having its highest concentrations in mid to later winter, especially in northern regions (figure, below right). More ozone during winter means that less high-energy ultraviolet radiation reaches the surface contributing to very cold surface temperatures. It is this accumulation of ozone that is depleted forming the winter polar ozone holes.
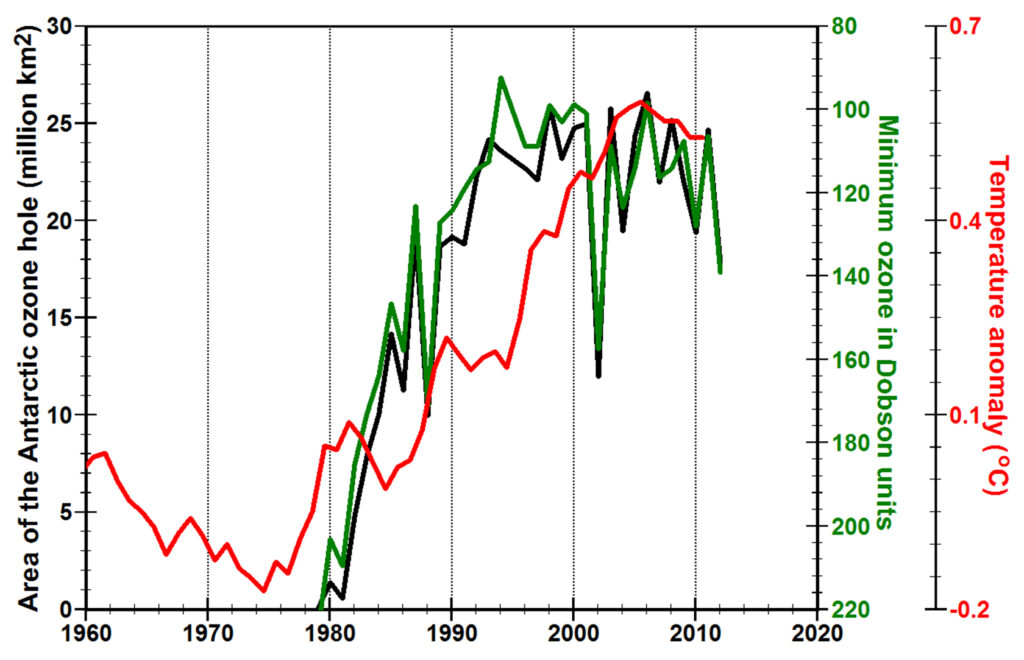
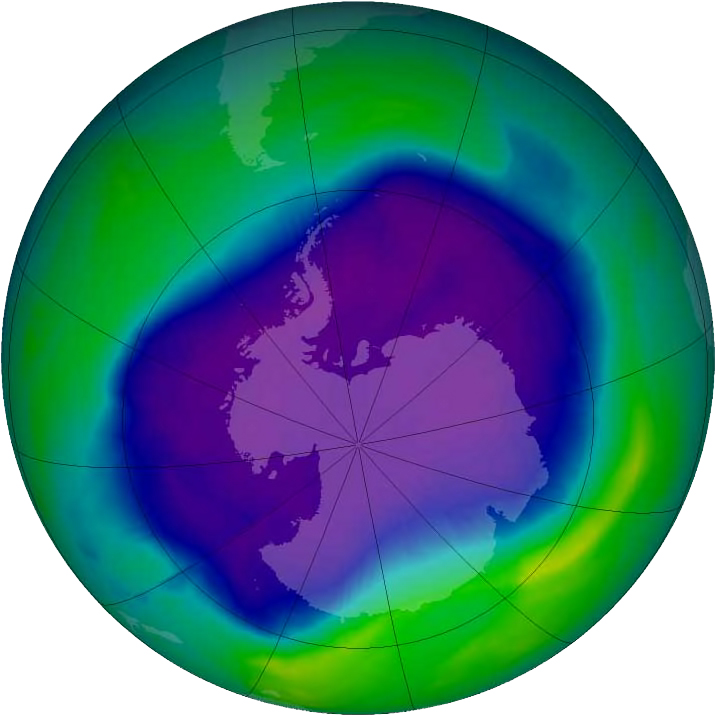
The most widely known variations in ozone occur in mid to late winter in polar regions. The Antarctic ozone hole, first discovered in 1985 (Farman et al., 1985), had begun forming by 1976, increasing rapidly in areal extent and “depth” until 1993 when emissions of anthropogenic chlorofluorocarbons began to be reduced as a result of the Montreal Protocol on Substances that Deplete the Ozone Layer. The area of the Antarctic ozone hole reached a maximum in September, 2006. Chemical destruction of ozone in the Arctic has been more limited than in Antarctica and quite variable. In 2011, however, ozone loss in the Arctic at 18 to 20 kilometers exceeded 80% (Manney et al., 2011).
“From the time of Dobson’s early measurements” in the 1920s, “it has been known that the total ozone amount undergoes large day-to-day fluctuations” (Reed, 1950) (Fioletov, 2008) in the mid to high latitudes. Daily averages of these large changes are now mapped throughout the world as observed from satellites and ground stations (Environment Canada, 2013). Animations of these daily ozone maps as well as measurements at each ground station (WOUDC, 2013) show that ozone amounts are continually changing even on a time scale of minutes Ozone animations.
Early observations also showed “that there is a strong correlation between column ozone and meteorological conditions” (Reed, 1950) (Fioletov, 2008), including atmospheric and surface temperatures and the resulting depth and location of surface pressure highs and lows. Ozone depletion allows more high-energy ultraviolet solar radiation into the lower troposphere where it either warms Earth directly or may warm the air through photodissociation of ground-level ozone, NO2, or possibly absorption by SO2. This warming can be across small regions and over timescales of hours to days, having a direct impact on weather systems.
When total column ozone is depleted, less solar energy warms the stratosphere causing the tropopause to rise, allowing more UV radiation to be absorbed by Earth. When total column ozone increases, more solar energy is absorbed in the stratosphere, warming the stratosphere, lowering the tropopause, cooling Earth. Ozone accumulates over the Arctic in winter (Fioletov, 2008), causing increased heating of the stratosphere and less heating of Earth resulting in minimum temperatures that are particularly cold during January in the Arctic and at mid-latitudes when Arctic air masses move southward. Depletion of this polar ozone peak warms minimum winter temperatures and it is this warming of minimum winter temperatures that is most clearly observed. The extremes of temperature are much larger during the winter when ozone accumulates and is depleted. For example, in Britain, the difference between record high and record low temperatures from 1870 through 1999 was 47oC during February-March and 38oC during July (Webb and Meaden, 2012).
On land, much of the energy absorbed during the day is radiated back into the atmosphere at night. At sea, however, ultraviolet radiation penetrates the ocean to depths of more than ten meters (Tedetti and Sempéré, 2006), making it more effective at heating the ocean than infrared radiation absorbed near the surface where much of the energy is lost back into the atmosphere at night. Similarly more ultraviolet energy is reflected back into the atmosphere on land than at sea. The effect of ultraviolet radiation on air temperatures could be small unless there is substantial lower-tropospheric pollution including O3 and NO2, while its effect on increasing ocean heat content could be substantial. The oceans account for 93% of the warming of the Earth system that has occurred since 1955 (Levitus et al., 2012).
Amidst all of this variation in the distribution of ozone, what matters most to climate is the mean annual changes in the concentrations of ozone in northern mid-latitudes.