Some Observational Problems with Greenhouse-Gas Theory
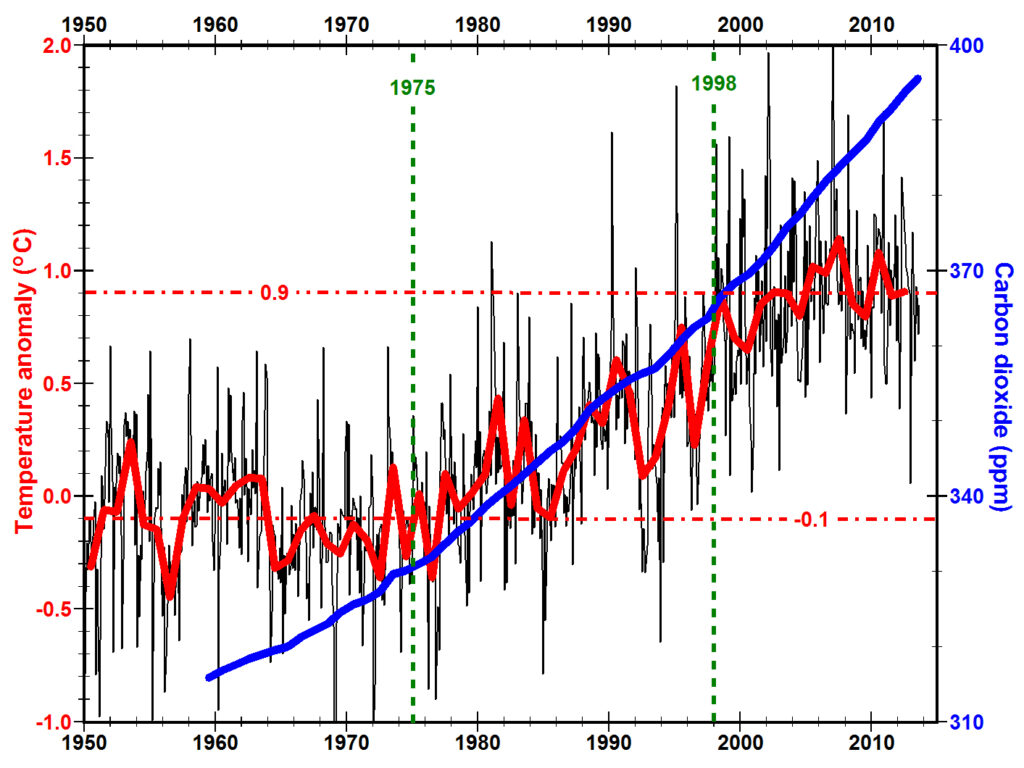
Since 1998, mean annual temperatures in the northern hemisphere (red line left) have remained fairly constant, rising only 0.05 ±0.08 oC per decade, essentially zero (Fyfe et al., 2013). Meanwhile carbon dioxide concentrations (blue line) measured at Mauna Loa Observatory in Hawaii have not only continued to increase but are increasing at a 33% greater rate (2 parts per million (ppm) per year from 1998 to 2012 compared to only 1.5 ppm/year from 1983 to 1997) (NOAA, 2013). Numerous studies argue that this divergence of temperature and CO2 trends is due to natural variations and other complexities of the climate system (Trenberth, 2009) (Easterling and Wehner, 2009) (Lean and Rind, 2009) (Douglass and Knox, 2009) (Loeb et al., 2009) (Solomon et al., 2010) (Trenberth, 2010) (Trenberth and Fasullo, 2010) (Kaufmann et al., 2011) (Santer et al., 2011) (Meehl et al., 2011) (Hansen et al., 2011) (Katsman and van Oldenborgh, 2011) (Scafetta, 2012) (Fyfe et al., 2013) (Smith, 2013) (Guemas et al., 2013) (de Elía et al., 2013) (Meehl et al., 2013) (Kosaka and Xie, 2013). But most agree that while 5 to 10 years of constant temperature due to natural variations is possible, 15 years is unlikely. This divergence creates a serious problem for greenhouse-gas theory yet to be explained convincingly.
Ocean heat content has also continued to increase (Levitus et al., 2009) (Levitus et al., 2012) (Trenberth and Fasullo, 2012). The solubility of carbon dioxide (CO2) in water is well known to decrease with increasing water temperature just as a carbonated beverage loses CO2 as it warms. Thus, rising atmospheric concentrations of CO2 could be a proxy for ocean heat content enhanced by such things as anthropogenic emissions and wind-driven upwelling around Antarctica (Anderson et al., 2009) (See solubility pump).
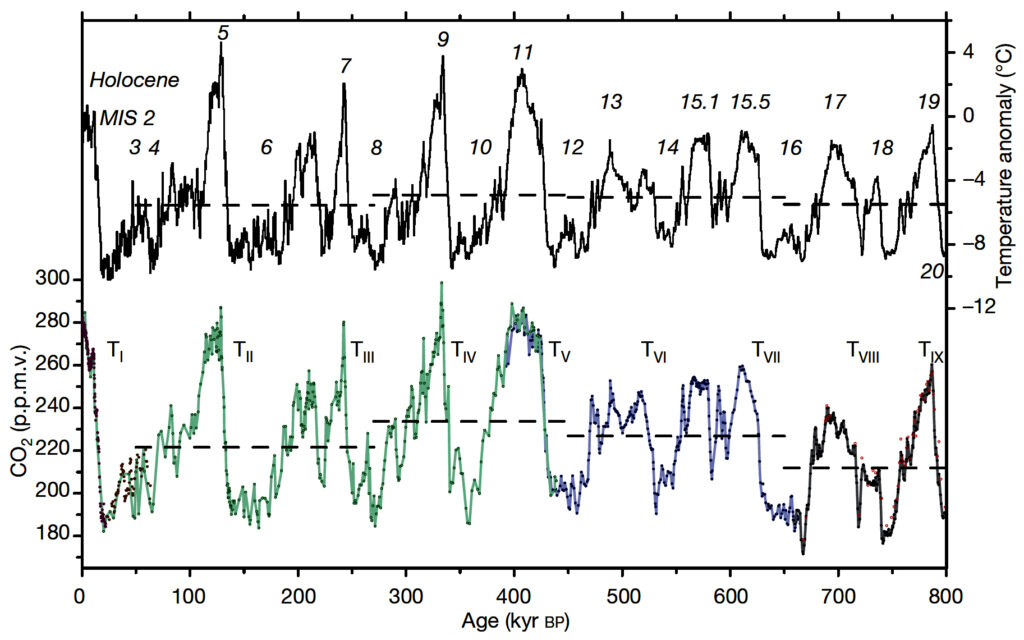
CO2 concentrations have increased and decreased at nearly the same time as global temperatures during ice ages (Siegenthaler et al., 2005) (Lüthi et al., 2008) (figure right). Many people see this as confirmation of greenhouse gas theory. But contemporaneity is not proof of cause. Most detailed studies suggest that CO2 levels before the 20th century rose after temperature increased (Fischer et al., 1999) (Monnin et al., 2001) (Caillon et al., 2003) (Stott et al., 2007) (Tachikawa et al., 2009) (Siegenthaler et al., 2005) (Pedro et al., 2012) although others disagree (Shakun et al., 2012) (Parrenin et al., 2013) pointing out that air is not trapped in snow until buried 50 to 120 meters, which can take hundreds of years in the Arctic and thousands of years in the Antarctic. Again, CO2 concentrations could be a proxy for ocean temperature.
CO2 is the second most voluminous gas erupted by volcanoes after water vapor. Pinatubo, in 1991, erupted 42 to 234 megatons of CO2 (Gerlach et al., 1996). But the increase in CO2 concentrations per year at Mauna Loa Observatory decreased from 1.4 ppm the year before the eruption to 1.0 the year after the eruption to 0.7 the second year after the eruption, returning to 1.2 the third year and 1.9 the fourth year. The most straight forward explanation is that the well observed cooling of 0.5oC for a couple of years, caused by the aerosols that formed in the lower stratosphere cooled the ocean so that it absorbed more CO2.
The sensitivity of climate to a doubling of CO2 is not observed in the laboratory nor in nature, it is calculated assuming that most warming during a certain period of time was caused by greenhouse gases (PALEOSENS Project Members, 2012). On the contrary, I have shown that ozone depletion plays a substantial role in warming Earth’s surface and must be taken into account during sensitivity studies.
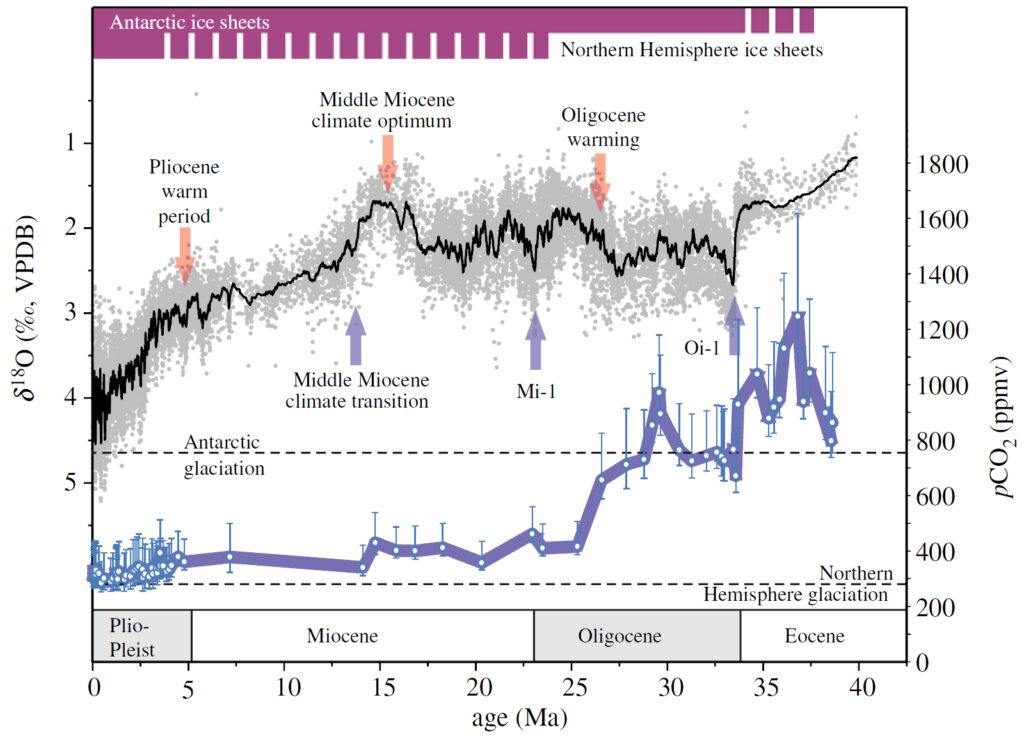
The relationship between rising temperature and rising concentrations of CO2 is not consistent throughout most of geologic time. For example, the figure to the left shows the δ18O proxy for temperature based on deep-sea, benthic foraminifera during the past 40 million years (Ma) (Zachos et al., 2008). The blue curve shows the partial pressure of atmospheric CO2 (pCO2) measured using the alkenone–pCO2 method on sediments from cores taken at Ocean Drilling Program Site 925 in the western equatorial Atlantic Ocean (Zhang et al., 2013). These data are broadly consistent with similar data measured elsewhere but benefit by eliminating the variation in oceanographic and algal growth conditions at different sites that potentially bias CO2 results.
The shapes of these two curves are quite different. There is little basis for arguing that pCO2 causes warming. In detail, note that the substantial warming and/or deglaciation between 27 and 23 million years ago (Ma) is accompanied by a long-term decrease in pCO2, the opposite predicted by greenhouse-gas theory (Zhang et al., 2013). Also at 23 Ma there is major positive δ18O excursion with no change in pCO2. Zhang et al. (2013, p.11) write “Our records suggest invariant CO2 concentrations during this apparent glaciation/deglaciation, defying our current understanding of the necessary forcing required to drive Antarctic ice sheet variability.” Note that pCO2 values are close to current values during the Miocene (23-5 Ma) while temperatures were substantially higher (Knorr et al., 2011). Global temperatures in the late Miocene with pCO2 less than 350 ppmv exceeded those in the early Pliocene with pCO2 greater than 350 (LaRiviere et al., 2012) (Fedorov et al., 2013). And “why did comparably low CO2 values 22 million years ago not initiate glacial cycles?” (Ruddiman, 2010, p. 838)
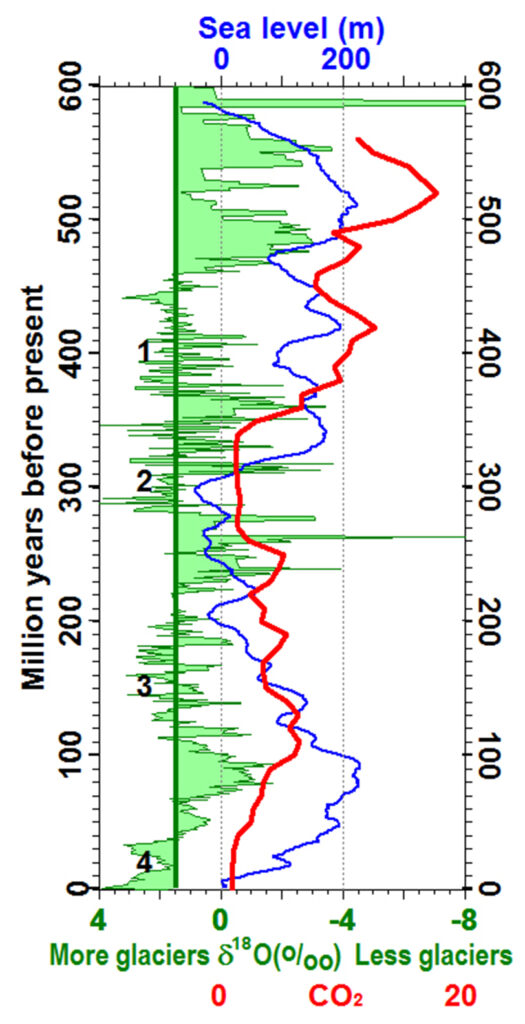
The green shaded area in the figure to the right shows the δ18O proxy for tropical sea surface temperature over the past 600 million years (Veizer et al., 1999). Values to the left of the vertical green line show times of ice ages; values to the right of the line show warmer times. The blue curve shows sea level (Haq et al., 1987) (Haq et al., 1988) (Haq and Schutter, 2008) (Ross et al., 2007) (Sea-level curve) (Miller et al., 2005). The red curve shows the ratio of the atmospheric concentration of CO2 to current concentrations based on a detailed model for the weathering of volcanic and other rocks (Berner, 2006a) (Berner, 2006b) with some calibration from fossil leaf stomata (Royer, 2001). The glacial epochs (numbers 1 to 4) are the only times when geologic evidence for glaciation are widespread (Crowell, 1999) (Frakes et al., 2005). Note that CO2 concentrations were 9 to 13 times current concentrations during glacial epoch 1, 1.4 times for epoch 2, and 3 to 6 times for epoch 3.
The width of the tropical belt widened 2o to 5o in latitude since 1979 (Seidel et al., 2008). Expansion in the Southern Hemisphere has been attributed to ozone depletion (Polvani et al., 2011) and “recent Northern Hemisphere tropical expansion is driven mainly by black carbon and tropospheric ozone, with greenhouse gases playing a smaller part” (Allen et al., 2012).
Periods of global warming typically start abruptly and are contemporaneous with major increases in volcanism at the end of the last ice age, during the 24 sudden Dansgaard-Oeschger warming events over the past 250,000 years (Dansgaard et al., 1993) (Ward, 2009), during the opening of the Greenland-Norwegian Sea in the early Eocene (Storey et al., 2007), and during the largest mass extinctions over the past 360 million years (Ward, 2009). Volcanic eruptions provide a clear explanation for sudden change while “a close examination of paleoclimatic data and modeling results does not show adequate support for many of the widely accepted explanations for abrupt climate change” (Rashid et al., 2011) including freshwater forcing, changes in sea ice extent , and tropical forcing (Clement and Peterson, 2008).
Since the concentration of CO2 is essentially homogeneous throughout the globe and increases monotonically with time, it is very difficult to explain how changes in CO2 concentrations can cause the clearly observed amplification of warming in Polar Regions (Serreze and Barry, 2011) and why the greatest warming occurs during mid-to-late winter.
Climate models that utilize CO2 as a primary driver of temperature increase have overestimated global warming since 1998 (Trenberth and Fasullo, 2010) (Hansen et al., 2005) and are probably overestimating warming in future decades. Their links to regional climate are also tenuous (Kerr, 2013).
Between 1975 to 1998, world mean temperatures and concentrations of CO2 suggest increasing CO2 might cause increasing temperature as predicted by the greenhouse-gas theory. Data from outside of that narrow time window do not seem to fit that model as readily. I show under Climate Trends that absorption by any gas of radiant energy not energetic enough to cause photodissociation does not appear to cause much warming. Even the greatest concentrations of ozone in the stratosphere are not at the levels of the greatest heating.