The Greatest Warming Occurred Where and When Ozone was Most Depleted
Depletion of ozone caused by anthropogenic chlorofluorocarbons is thought to occur primarily in polar stratospheric clouds that form when temperatures drop below -78oC within each polar vortex. The vortex centered over Antarctica forms in May and dissipates in October at latitudes greater than ~60oS (Waugh and Polvani, 2010) (Hassler et al., 2011). The Antarctic ozone hole typically reaches its maximum extent during September and its lowest values of ozone in late September to early October (NASA, 2013). By 1989, ozone levels each October at Faraday/Vernadsky Research Base near the Antarctic Peninsula (65.3oS, 64.3o)W had become depleted by ~45% compared to average levels from 1957 through 1970 (350 DU, Dobson Units) (Hassler et al., 2011). Minimum yearly ozone levels throughout Antarctica have typically been depleted 45 to 55% relative to levels in 1979 (225 DU) when satellite measurements began (NASA, 2013). During this time, the vortex has become “stronger, colder, and more persistent” (Waugh and Polvani, 2010).
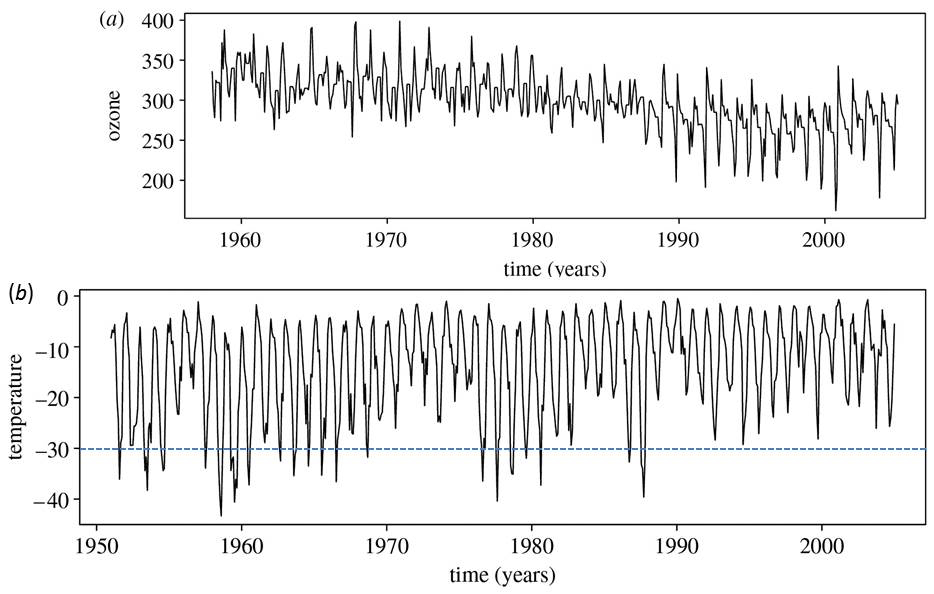
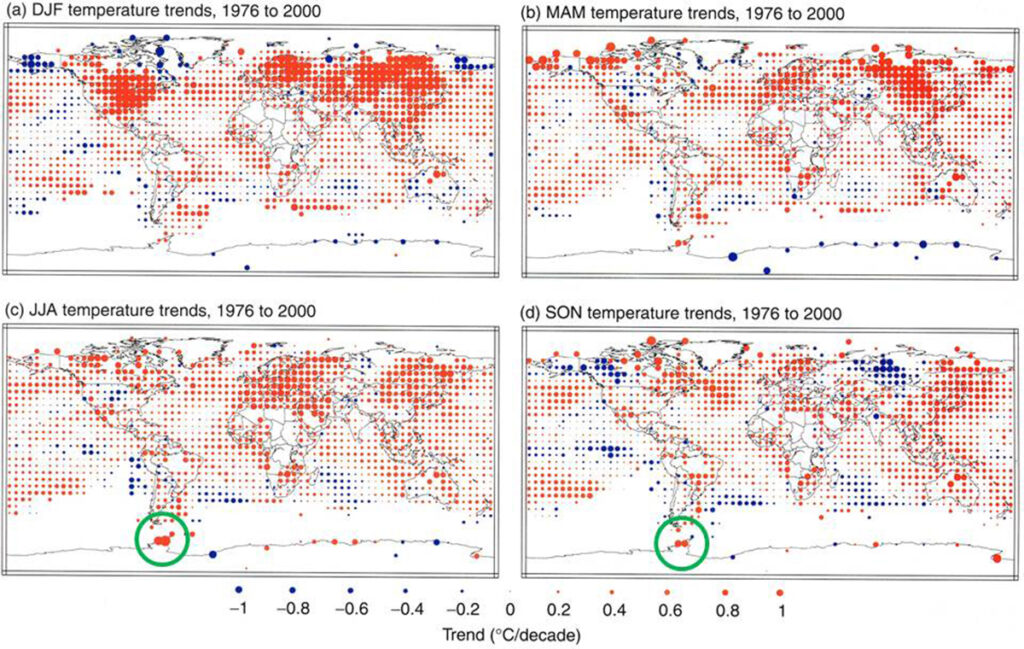
The largest warming trend in the world observed between 1976 and 2000 was along the Antarctic Peninsula during the June-July-August time period continuing into the September-October-November as shown by the green circles in the figure to the right (Folland et al., 2001). Minimum monthly temperatures at Faraday/Vernadsky Research Base increased 6.7oC from 1951 to 2003 (Hughes et al., 2007), the greatest warming of this region in more than 1800 years (Vaughan et al., 2003) (Mulvaney et al., 2012). These rapid increases in temperature “were strongly correlated” with decreases in total column ozone (Hughes et al., 2007). During summer months when ozone is not depleted, maximum monthly temperatures have changed very little since observations began. Between 1958 and 2010, annual mean temperatures increased 3oC at Faraday/Vernadsky station and 2.4oC; at Byrd Station (80oS, 199.5oW) compared to 0.7oC globally (Bromwich et al., 2013).
Decreased ozone allows more ultraviolet solar radiation to reach Earth’s surface where it is absorbed most efficiently by ice-free water, a band of which hundreds of kilometers wide exists off the ice-bound coast of Antarctica but still within the Antarctic ozone hole (Parkinson and Cavalieri, 2012). Summer surface temperatures of the Bellingshausen Sea rose 1oC (Meredith and King, 2005), the Circumpolar Deep Water of the Antarctic Circumpolar Current warmed (Clarke et al., 2007), and formation of cold Antarctic Bottom Water decreased substantially (Purkey and Johnson, 2012). “Southern oceans have warmed at roughly twice the rate of global mean ocean” (Waugh et al., 2013).
Along the Antarctic Peninsula, winter sea ice decreased 10% per decade and shortened in seasonal duration (Clarke et al., 2007); 87% of the marine glaciers in this region retreated, many collapsing into the ocean following the loss of seven very large ice shelves (Clarke et al., 2007) (Stammerjohn et al., 2008). Warming of interior Antarctica was slowed by the high mean albedo (~0.86) of Antarctic snow, nearly twice the albedo of Arctic snow (Wang and Zender, 2011), and by the decrease in solar flux approaching South Pole.
The Arctic is the region with the second greatest increase in surface temperatures (Folland et al., 2001) (Trenberth et al., 2007). Ozone is depleted primarily during December, January and February within the Arctic polar vortex (Waugh and Polvani, 2010) but spreads south to mid-latitudes in spring enhanced by increasing NOx -related “summer” depletion (Hansen and Chipperfield, 1999) (Andersen and Knudsen, 2006). The asymmetric distribution of mountains, land, and ocean throughout the Arctic makes this vortex much more variable than the Antarctic vortex on daily to inter-annual time scales (Waugh and Polvani, 2010).Click for animation of Arctic Polar Vortex. The greatest amounts of total column ozone collect near and just outside the edge of the polar vortex in the polar night jet located throughout the stratosphere. Ozone concentrations change very dynamically as shown in the of daily ozone maps animations (Environment Canada, 2013). Ozone depletion during winter/spring has been increasing in the Arctic since the 1950s, exceeding 80% at altitudes of 18 to 20 km in early 2011, comparable for the first time with the Antarctic ozone hole (Manney et al., 2011).
Temperatures north of 65oN increased at a rate of approximately twice the global average from 1965 to 2005 (Lemke et al., 2007). Annual mean land-surface temperatures north of 60oN increased 1.5oC between 1966 and 2003 (McBean et al., 2004) (Jeffries and Richter-Menge, 2012) compared to 1.0oC for the northern hemisphere as a whole (CRUTEM4, 2013), unprecedented in the past 600 years (Tingley and Huybers, 2013). Satellite data from 1981 to 2005 for all areas north of 60oN show an average increase of 1.7oC with increases of 2.9oC over Greenland, 2.0o over North America, 1.3o over sea ice, and 0.3oC over Europe (Comiso, 2006). The average increase in monthly mean temperature from 1966 thru 2010 was >5oC north of 70oN, >4oC from 65o to 70oN, >1.5oC from 55o to 60oN and for the months of June through September was <2oC for all stations on land throughout the northern hemisphere (CRUTEM4, 2013).
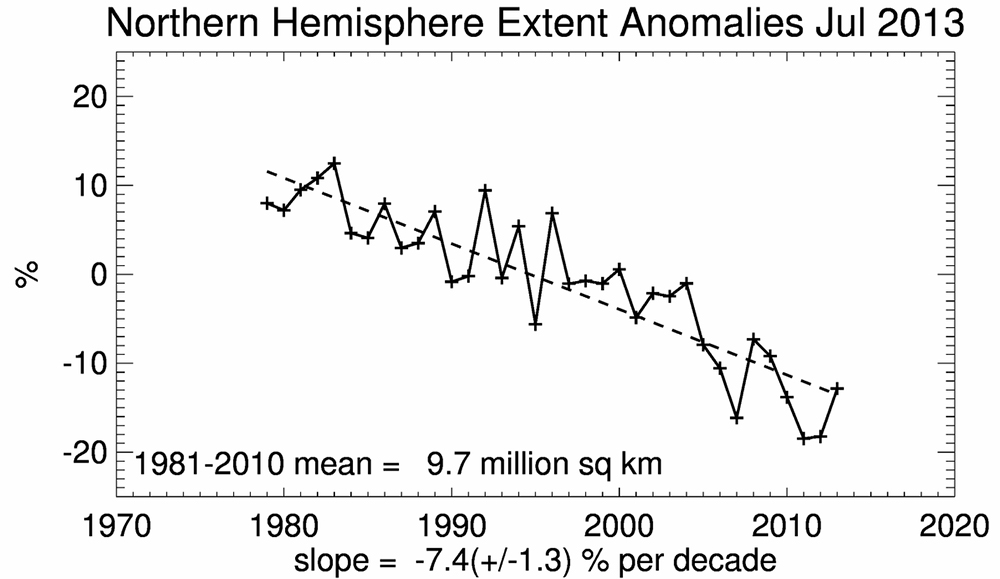
The extent of Arctic sea ice, declining at >11% per decade since 1979 (Kwok and Untersteiner, 2011), reached a record low on September 16, 2012, nearly 50% lower than the average extent between 1979 and 2000 (NSIDC, 2012). The extent of terrestrial snow cover in June has decreased 17.8% per decade since 1979 (Derksen and Brown, 2012). Average snow-covered area in the northern hemisphere decreased ~7% primarily since 1982 (Lemke et al., 2007). Loss of ice in Greenland has been accelerating at a rate of 21.9 Gt/yr2 (Rignot et al., 2011). The Canadian Arctic Archipelago has been losing ice at a rate of 61 Gt/yr (Gardner et al., 2011). Ice-cap melt rates on Ellesmere Island in the last 25 years have been the highest observed in 4200 years (Fisher et al., 2012).
The greatest rates of the warming observed since the 1950s have been located in Polar Regions during winter/spring when and where total column ozone has been most depleted.