Ozone Concentrations Observed Since 1927
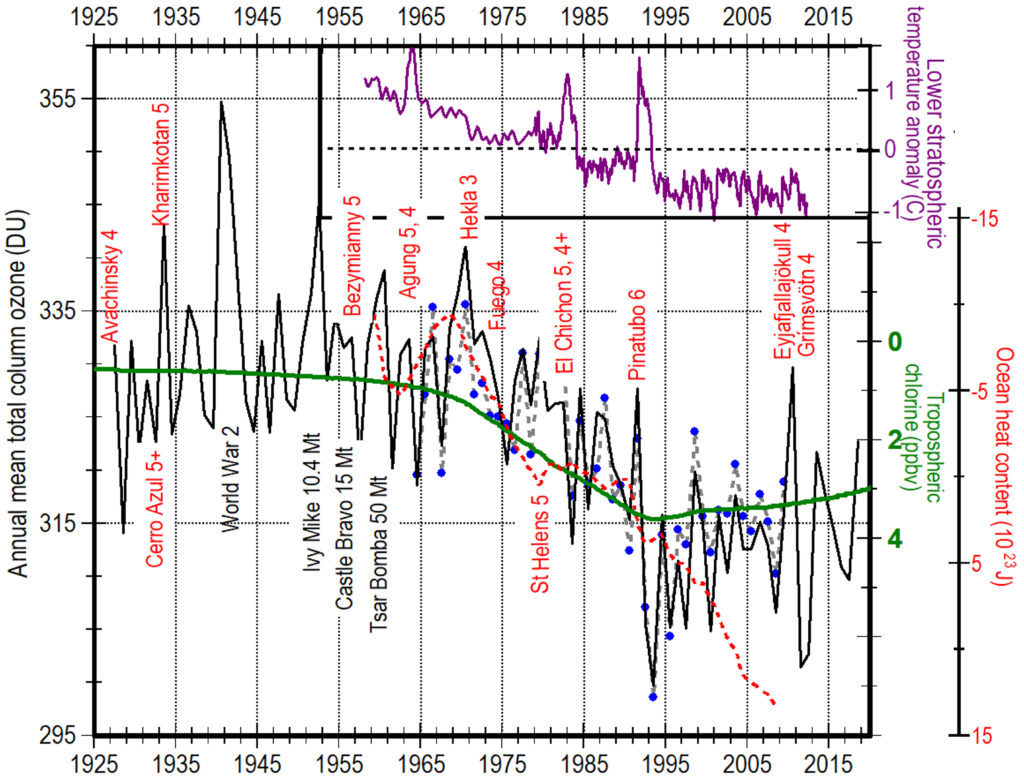
The longest continuous measurements of total column ozone (black line) have been made since 1927 at Arosa, Switzerland (46.8oN, 9.7oE) (Staehelin et al., 1998). The dashed gray line with blue data markers shows, for 1964 to 2009, the annual mean area-weighted total ozone deviation from the 1964 to 1980 means for northern mid-latitudes (30oN to 60oN) scaled from -8% at the bottom of the figure to 10% at the top (Douglass et al., 2011). Years of increasing or decreasing ozone are nearly identical at Arosa and for this area-weighted mean with small differences in amplitude. Thus the Arosa data provide a reasonable approximation for annual mean total column ozone throughout northern mid-latitudes since 1927.
Ozone at Arosa averaged 331 Dobson units (DU) until 1974, fell 9.4% to 300 DU by 1993 and began generally rising again until 2011. The long-term decrease in ozone has been reliably associated with an increase in the concentration of anthropogenic tropospheric chlorine (green line, y-axis inverted) through chlorine catalyzed destruction of ozone (Solomon, 1999). The resulting Montreal Protocol on Substances That Deplete the Ozone Layer was signed beginning in 1987, leading to phasing out the production of chlorofluorocarbons and hydrochlorofluorocarbons and a decrease in tropospheric chlorine beginning in 1993. Long-term chlorine concentrations are expected to return to late-1970’s levels by 2040 (Solomon, 1999).
The lowest levels of annual mean total column ozone were observed in 1992 and 1993 following the 1991 eruption of Mt. Pinatubo (Kerr, 1993), the largest explosive eruption since 1912, and in 2011 and 2012 following the eruption of Eyjafjallajökull in 2010, one of the larger effusive eruptions of the past century. The size of an explosive volcanic eruption is typically measured using the logarithmic Volcanic Explosivity Index (VEI) based primarily on the volume of tephra erupted and the maximum height of the eruption column (Newhall and Self, 1982) (Siebert et al., 2010). The size of effusive volcanic eruptions is best measured using the volume of magma extruded. Volcanoes labeled in red include all very large explosive volcanic eruptions with VEI ≥5, some VEI 3 and 4 effusive eruptions in Iceland, and two explosive VEI 4 eruptions from volcanoes elsewhere that typically included substantial lava flows (Global Volcanism Program, 2013). All volcanic eruptions shown were followed a year later by a substantial decrease in annual mean total column ozone except the 1980 eruption in Washington state of Mt. St. Helens, an unusual blast of steam triggered by a landslide on the intruding volcanic plug (Druitt, 1992). Most other small volcanic eruptions since 1927 appear to cause similar changes in ozone, but the signal-to-noise ratios are too small to draw reasonable conclusions.
There is an increase in ozone the year of most of these eruptions compared to the previous year as discussed in more detail in Pre-eruption Ozone. There are also large peaks in annual mean total column ozone during years containing the three largest atmospheric nuclear tests labeled in black with yield in megatons (Johnston, 1977). The largest short-term peak in ozone was in 1940 and 1941 during the major territorial conquests of World War II. Any causal relationship is unclear. There is also a peak in 1998 during one of the largest El Niños in history but no obvious peak in 1982 and 1983 during an El Niño with a comparably large multivariate ENSO index (NOAA, 2013), although the latter observation may have been complicated by the eruption of El Chichón in 1982. But the most consistent short-term changes in ozone are an apparent increase in ozone during the year of a volcanic eruption followed by a much larger depletion during the next few years.
Pinatubo erupted in the Philippines on June 15, 1991, (VEI 6) followed closely by the eruption of Cerro Hudson in southern Chile on August 12, 1991 (VEI 5+). Annual mean ozone increased 3.9% in 1991 primarily between February 19 and 26 discussed in Pre-eruption Ozone. By 1993, annual mean ozone dropped 8.5% to 300 DU, the lowest level ever recorded as of that time (Gleason et al., 1993) (Angell, 1997). Total column ozone was 11 to 17% below preceding years throughout Canada with a peak loss of 30% at ~16 km (Kerr et al., 1993). On average, total ozone decreased 8% in Europe, 5 to 6% in North America, Russia, and Asia but <2% in the tropics (Angell, 1997). Following the 1982 eruptions of El Chichón in Mexico (VEI 5 and 4+), total ozone similarly decreased 5% in Europe, 3% in North America and Russia and <1% in the tropics (Angell, 1997). Following the 1963 eruptions of Agung in Bali (VEI 5 and 4), total ozone fell 5% in Europe and Asia, 2% in North America, and <1% in the tropics (Angell, 1997).
An even larger ozone anomaly in 2010 is associated with the 100-times less-explosive basaltic effusive eruption of Eyjafjallajökull in Iceland (VEI 4). A slightly larger (VEI 4) eruption of Grímsvötn, 140 km northeast of Eyjafjallajökull, occurred in May 2011, compounding the amount of ozone depletion during 2011 and 2012. The amplitudes of these short-term ozone anomalies since 1990 are larger than the amplitudes of earlier volcanic anomalies before the global rise in tropospheric chlorine (green line, y-axis inverted). Similar anomalies appear associated with the eruption of Hekla in Iceland (1970, VEI 3).
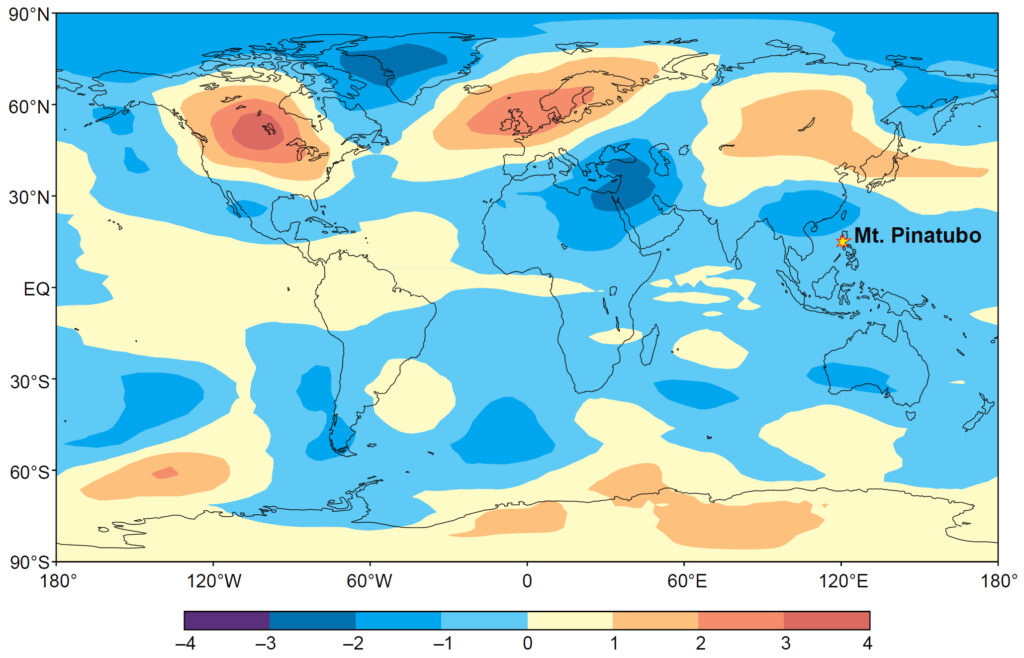
Following the eruption of Pinatubo, the lower troposphere warmed up to 3oC during the winter throughout the northern parts of northern continents (Robock, 2002), the parts with greater depletion of ozone. Related major changes in atmospheric chemistry are well documented by a 45% drop in total column nitrogen dioxide (NO2) above Switzerland beginning five months after the Pinatubo eruption and returning to normal with an e-folding time of two years (De Mazière et al., 1998), a 40% decrease in NO2 column observed above New Zealand (Johnston et al., 1992), and substantial increases in nitric acid (HNO3) concentrations due to heterogeneous conversion of dinitrogen pentoxide (N2O5) (Coffey, 1996).
The observed ozone depletion (black line, figure above right) was accompanied by cooling of the stratosphere (purple line) occurring mostly “as two downward ‘steps’ coincident with the cessation of transient warming after the major volcanic eruptions of El Chichón and Mount Pinatubo” (Thompson and Solomon, 2009) and a similar downward step following the 1963 eruptions of Agung volcano (Randel, 2010).
Ozone depletion following volcanic eruptions has traditionally been explained by new aerosols formed in the lower stratosphere providing substantial new surfaces for heterogeneous chemical reactions to form ozone-destroying chlorine at cold temperatures in a polar vortex (Angell, 1997). Yet water vapor (H2O), the most voluminous gas erupted from volcanoes, is the primary source of hydroxyl radicals (OH) that catalytically destroy ozone in the stratosphere (Coffey, 1996) (Anderson et al., 2012). Volcanoes also erupt megatons of halogens (Coffey, 1996), primarily chlorine and bromine (SPARC, 2009, pdf), and only one halogen molecule can destroy >100,000 molecules of ozone (Molina and Rowland, 1974). During explosive eruptions, many of these halogens appear to be removed immediately from the eruptive cloud in condensed supercooled water (Tabazadeh and Turco, 1993). But effusive, basaltic eruptions, such as Eyjafjallajökull and Grímsvötn, do not form significant eruption columns that remove halogens and create aerosols in the stratosphere. They typically involve 10 to 100 times more volatiles per cubic kilometer of magma than explosive eruptions (Palais and Sigurdsson, 1989) (Freda et al., 2005) (Self et al., 1996). Ozone depletion is substantial within the plumes of erupting volcanoes; detailed observations imply that “the most likely cause for the observed rapid and sustained O3 loss to be catalytic reactions with halogen, mainly bromine, radicals” (Vance et al., 2010). Recent observations have shown that even the plumes of quiescently degassing volcanoes are chemically very active, containing halogens that modeling shows cause ozone depletion (von Glasow, 2010). Between erupting many halogens and injecting large amounts of water into the stratosphere (Anderson et al., 2012), volcanoes appear to deplete ozone along many more chemical paths than attributed to anthropogenic chlorofluorocarbons.
Volcanic eruptions are typically followed a year later by ~6% depletion of ozone averaged throughout the year. How do these short-term effects of volcanism compare to the longer-term effects of anthropogenic chlorofluorocarbons? The green line for chlorine is inverted and has been scaled so that the increase in anthropogenic tropospheric chlorine from 1965 to 1993 has approximately the same rate of change as the corresponding long-term decrease in ozone as expected by current theory. This visual fit suggests that depletion of ozone following the Pinatubo eruption (~20 DU) was twice as large as the depletion due to anthropogenic chlorofluorocarbons since 1960 (~10 DU) and that it takes more than a decade for ozone concentrations to return to pre-eruption levels.
In summary, large, explosive volcanic eruptions are well known to form sulphuric acid aerosols in the lower stratosphere that reflect, scatter, and absorb solar radiation, causing cooling at Earth’s surface of up to 0.6oC over three years. These explosive eruptions also deplete ozone causing warming that lasts 3 to 5 times longer than the aerosols, but the cooling effects of the aerosol predominate during the first three years except in winter/spring over northern continents when ozone depletion is particularly strong. The much less explosive and much more numerous basaltic effusive eruptions such as Eyjafjallajökull and Grímsvötn as well as quiescently degassing volcanoes (von Glasow, 2010) do not form significant aerosols in the lower stratosphere so that ozone depletion and related warming dominate.