CO2, temperature, and sea level during the past 600 million years
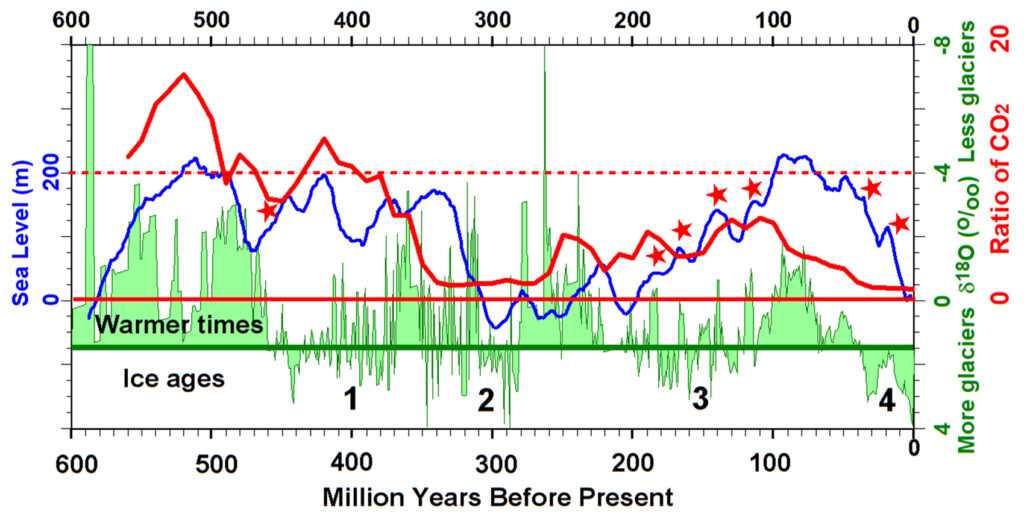
Major volcanic activity in large rhyolitic provinces (red stars,Table) typically precedes or accompanies an increase in glaciation and a decrease in sea-level throughout the last 600 million years. The shaded green areas show the δ18Oproxy for tropical sea surface temperature (Veizer et al., 1999). Values below the horizontal green line show times of ice ages; values above the line show warmer. The blue curve shows sea level (Haq et al., 1987) (Haq et al., 1988) (Haq and Schutter, 2008) (Ross et al., 2007) (Sea-level curve) (Miller et al., 2005). The red curve shows the ratio of the atmospheric concentration of CO2 to current concentrations based on a detailed model for the weathering of volcanic and other rocks (Berner, 2006a) (Berner, 2006b). Note that CO2 concentrations were as much as 13 times current concentrations during glacial epoch 1 and as much as 6 times current concentrations during glacial epoch 3.