Steps Into and Out of an Ice Age
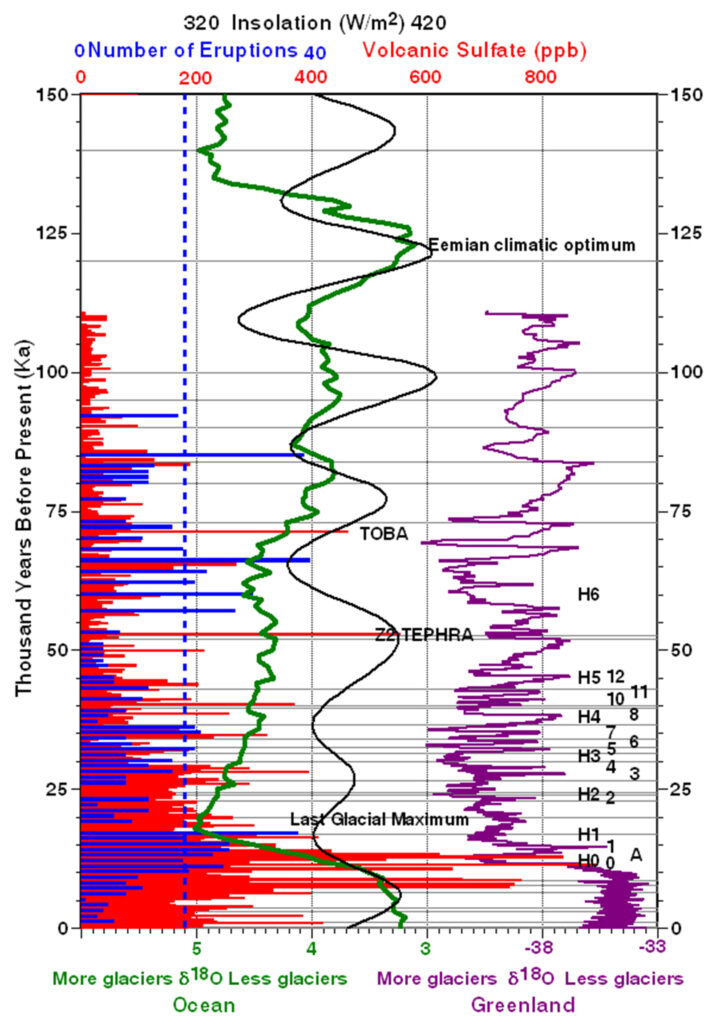
The most recent glacial cycle involves incremental decreases in temperature over 100,000 years followed by rapid warming of the same amount in less than 8000 years. The green line is the stacked δ18O proxy for tropical benthic temperature and ice volume (Lisiecki and Raymo, 2005) with lowest temperatures to the left and a temperature range of approximately 2.8oC between the Last Glacial Maximum and the present (Lea et al., 2000). The black curve shows the changes in temperature resulting from earth orbital changes as predicted by Milanković (Laskar et al., 2004). The purple line is the δ18O proxy for temperature and glaciation on the glacial surface in Greenland (White et al., 1997) (Data, Stacked). Horizontal black lines are major volcanic eruptions (Table). Red bars show individual sulfate anomalies measured in the GISP2 ice core (Zielinski et al., 1996) (Data, Volcanic markers). Blue bars show the number of eruptions per century inferred by Zielinski et al. (1996) to correct for ice compaction. The dashed blue line at 18 eruptions per century is the approximate boundary between the cooling effects of a small number of eruptions and the warming effects of a large number of eruptions. Toba is the largest known volcanic eruption since 28 Ma and the Z2 tephra is a volcanic ash widely recognized in deep-sea sediment cores. H0 thru H6 are Heinrich events. Numbers 0 thru 12 and the letter A are Dansgaard–Oeschger sudden warming events. The largest sulfate anomalies clearly coincide with the rapid warming since the Last Glacial Maximum.