Volcanism and Glaciation Over the Past 120 Million Years
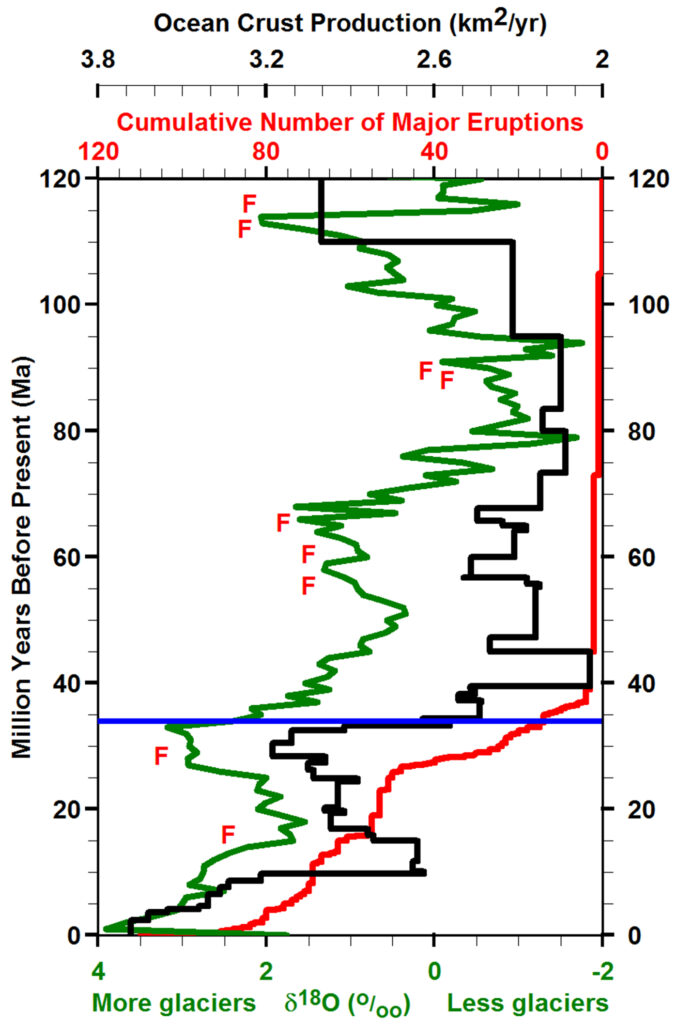
A major increase in volcanism led to the modern glacial epoch. The red line shows the cumulative number of known large volcanic eruptions (Table). The green line is based on δ18O measured in shells of foraminifera, a proxy for mean paleotropical sea-surface temperature and global ice volume with lowest temperatures and more glaciers to the left (Veizer et al., 1999). The range in temperatures is approximately 7oC (Lea, 2000). The blue line at 33.9 Ma shows the time of major cooling of the earth leading to sudden major glaciation in Antarctica and major changes in flora and fauna in North America and Eurasia (Zanazzi et al., 2007) (Dupont-Nivet et al., 2007) (Kerr, 1992) (Prothero and Emry, 1996). The black line shows the area of ocean crust formed per year (Cogné and Humler, 2006). Note the major increase in seafloor production and volcanism around 34, 12 and 3 Ma. Red “F” symbols show times of major flood basalts (Table).