Global Temperatures Since 1998 Have Remained Relatively Constant While CO2 Concentrations Continue to Increase
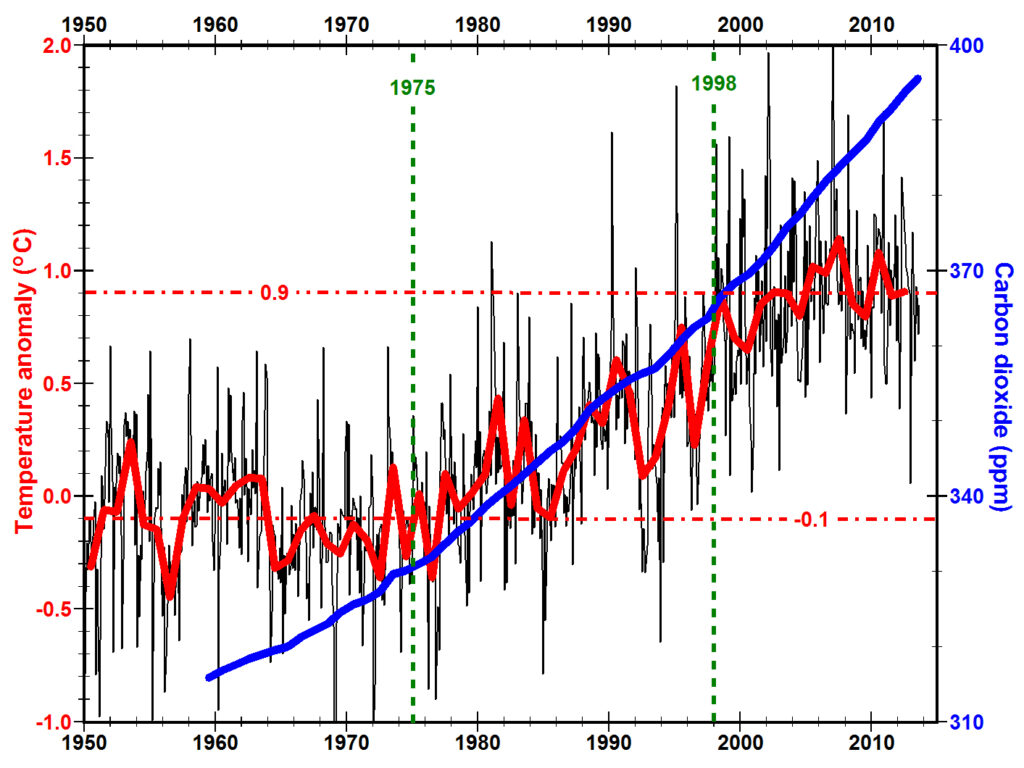
The black line shows the global monthly mean temperature anomaly from 1950 through 2012 (HadCRUT4.2) (Jones et al., 2012). The red line shows the global annual mean temperature anomaly. Temperature anomaly is the value of temperature measured minus the average temperature measured at that station from 1961 through 1990. The dot-dashed red lines show the average of all monthly temperature means between 1961 and 1975 (-0.1oC) and 1998 and 2012 (0.9oC). The blue line shows the annual mean concentration of carbon dioxide measured on Mauna Loa, Hawaii (NOAA, 2013).
Temperature anomaly and CO2 concentrations increased together from 1975 to 1998 as predicted by greenhouse-gas theory. But temperatures have remained relatively constant since 1998 while CO2 concentrations have continued to increase at an increasing rate (2 ppm/year from 1998 to 2012 compared to 1.5 ppm/year from 1983 to 1997). Similarly, temperature anomalies from 1950 to 1975 appear to remain relatively constant while CO2 concentrations are increasing.