Temperature, Sea Level, CO2 Concentrations, and Ice Ages
for the Past 600 Million Years
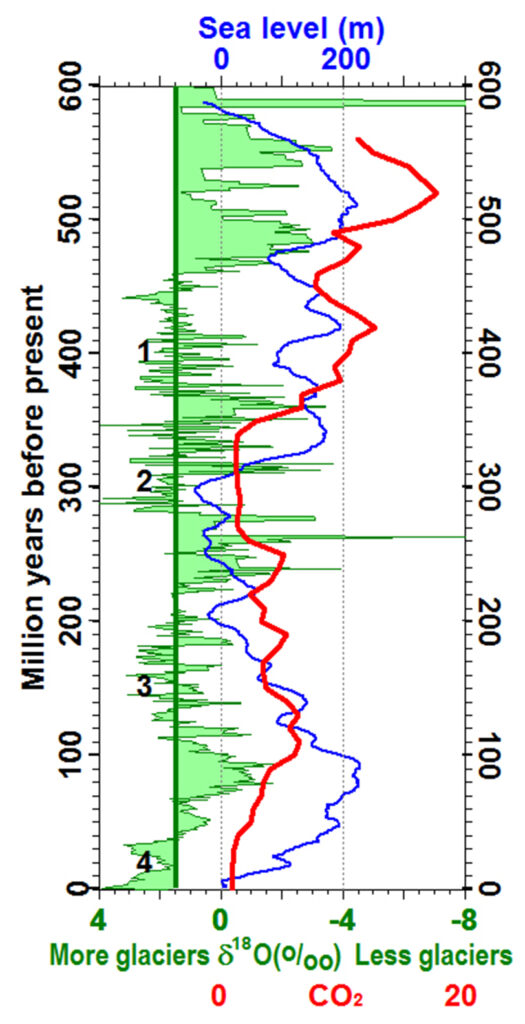
The green shaded area shows the δ18O proxy for tropical sea surface temperature (Veizer et al., 1999). Values to the left of the vertical green line show times of ice ages; values to the right of the line show warmer times. The blue curve shows sea level (Haq et al., 1987) (Haq et al., 1988) (Haq and Schutter, 2008) (Ross et al., 2007) (Sea-level curve) (Miller et al., 2005). The red curve shows the ratio of the atmospheric concentration of CO2 to current concentrations based on a detailed model for the weathering of volcanic and other rocks (Berner, 2006a) (Berner, 2006b) with some calibration from fossil leaf stomata (Royer, 2001). The glacial epochs (numbers 1 to 4) are the only times when geologic evidence for glaciation are widespread (Crowell, 1999) (Frakes et al., 2005). Note that CO2 concentrations were 9 to13 times current concentrations during glacial epoch 1, 1.4 times for epoch 2, 3 to 6 times for epoch 3.