CO2 concentrations and Temperature for the Past 800,000 Years
There is a close correlation in time between temperatures and CO2 concentrations over the past 800,000 years as shown in this figure and caption taken from Figure 2 of Lüthi et al. (2008).
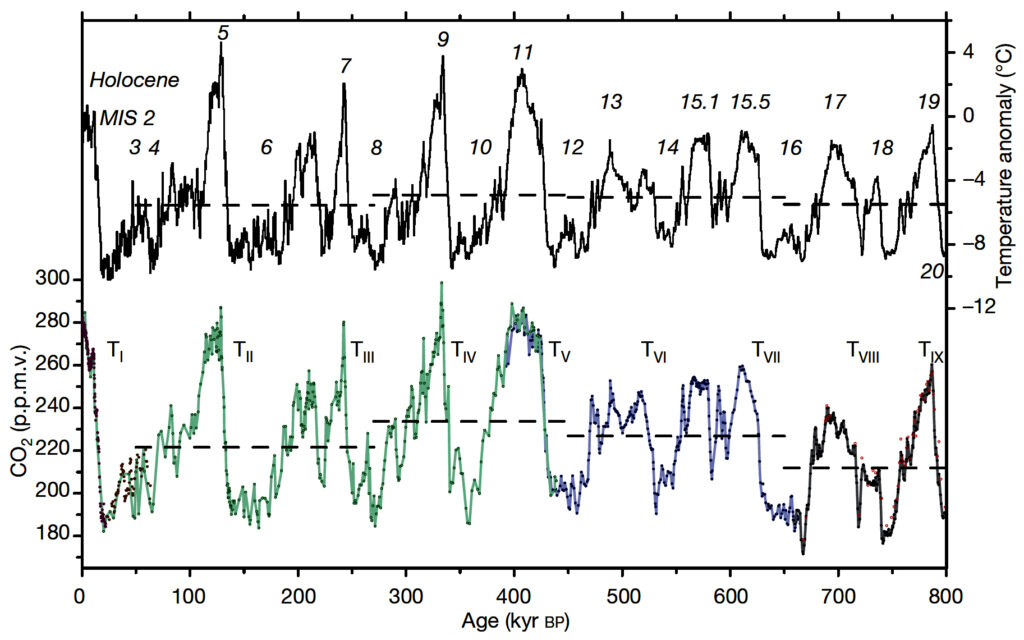
Compilation of CO2 records and EPICA Dome C temperature anomaly over the past 800 thousand years (kyr). The Dome C temperature anomaly record with respect to the mean temperature of the last millennium (Jouzel et al., 2007) (based on original deuterium data interpolated to a 500-yr resolution), plotted on the EDC3 timescale (Parrenin et al., 2007), is given as a black step curve. Data for CO2 are from Dome C (solid circles in purple (Monnin et al., 2001), blue (Siegenthaler et al., 2005), black: this work, measured at Bern; red open circles: this work, measured at Grenoble), Taylor Dome (Indermühle et al., 2000) (brown) and Vostok (Petit et al., 1999) (Pépin et al., 2001) (Raynaud et al., 2005) (green). All CO2 values are on the EDC3_gas_a age scale (Loulergue et al., 2007). Horizontal lines are the mean values of temperature and CO2 for the time periods 799–650, 650–450, 450–270 and 270–50 kyr BP. Glacial terminations are indicated using Roman numerals in subscript (for example TI); Marine Isotope Stages (MIS) are given in italic Arabic numerals (Lisiecki and Raymo, 2005).