UV Index as a Function of Total Column Ozone
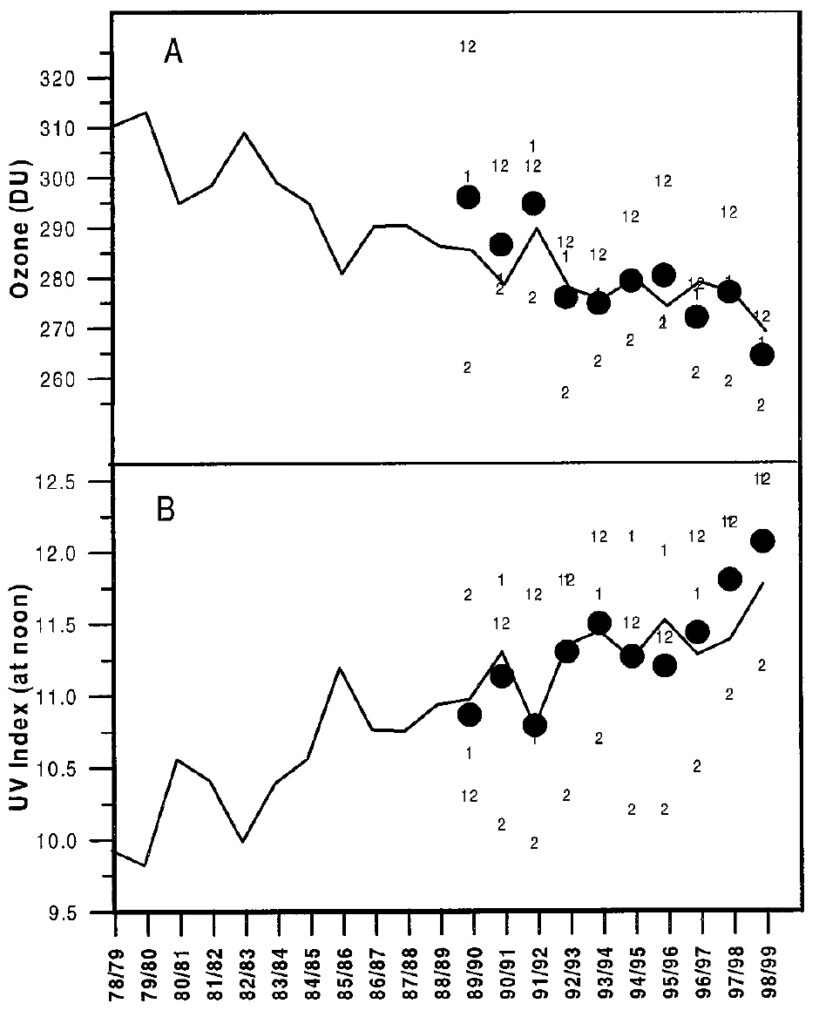
(A) Mean ozone in Dobson units and (B) estimated UV Index at Lauder, New Zealand, for the summer of 1978-79 through the summer of 1998-99 (McKenzie et al., 1999, Figure 1). Summer is defined as the period from December through February. The solid line in (A) shows the changes in summertime ozone that have occurred since the 1970s. The solid line in (B) shows the deduced changes in clear-sky UV radiation expected from these changes in ozone. The values from each contributing month are shown labeled by month number.
The sensitivity of UV radiation to ozone change is given by the radiative amplification factor (RAF), which gives the increase expected for each 1% decrease in ozone. Changes were deduced with a simple power law relation between changes in ozone and changes in UV. The RAF for erythemal UV radiation under these conditions is 1.2 (Madronich et al., 1995) (Madronich et al., 1998).
The circles (from 1989-90 on) show measured values of ozone and the summertime peak UV Index, both derived from the UV spectroradiometer. The UV Index represents the integral of the spectrum (watts per square meter per nanometer) weighted by the erythemal action spectrum and scaled by 40. The UV Index was originally devised in Canada to give maximum values of around 10 in that country.
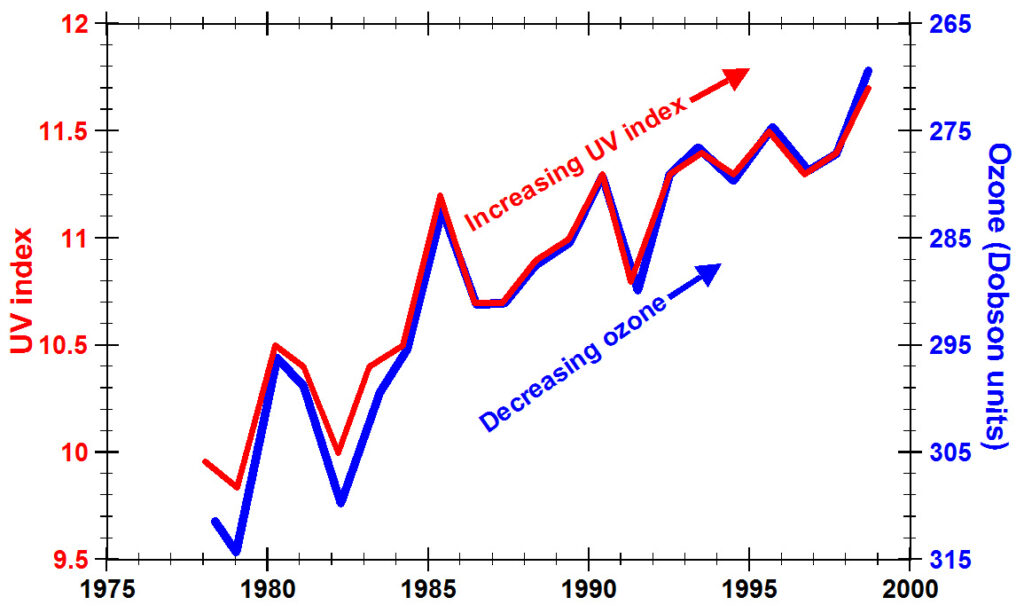
Total column ozone (blue line, y-axis reversed) measured at Lauder, New Zealand, decreased from 1979 to 1998 as the calculated UV index (red line) increased (McKenzie et al., 1999). Taken from the figure above.