Temperature, Density, Ozone Profile of Earth’s Atmosphere
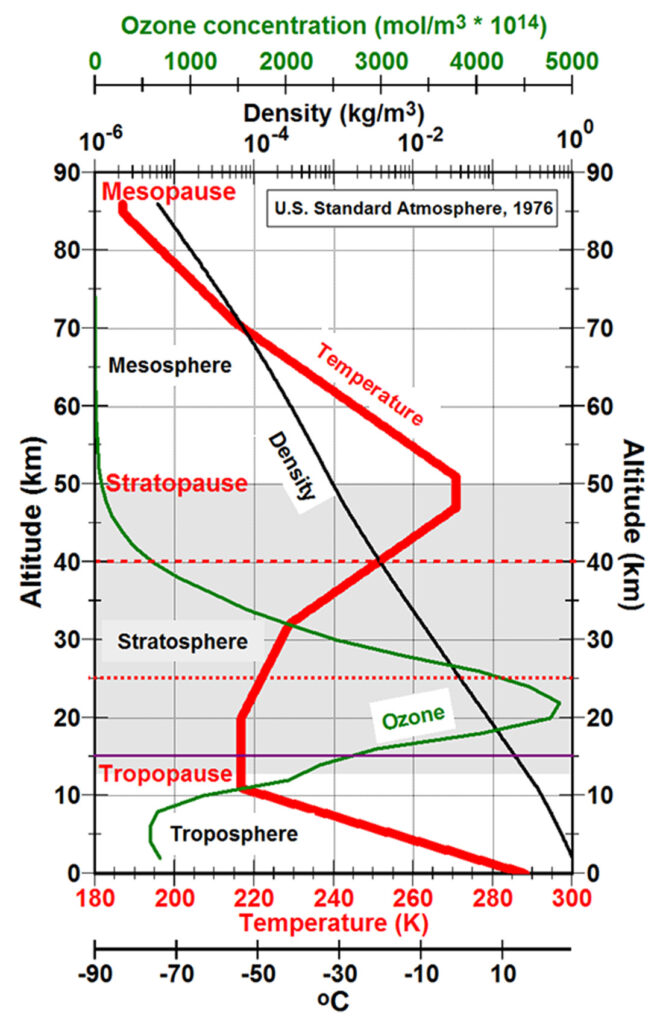
Temperature (red), density (black), and ozone concentration (green) as a function of altitude in kilometers (km) for the The U.S. Standard Atmosphere (1976), a hypothetical model for the vertical distribution of atmospheric properties approximating mid-latitude conditions throughout the year. “The model is empirical, being based upon temperature measurements by radiosondes, rocketsondes, rockets and satellites and is defined in terms of a temperature profile extending from -5 to 1000 km. This profile is chosen so that the vertical profiles of pressure, density and composition, derived using one-dimensional physical equations, and the temperatures provide a best fit to the experimental data for the defined standard conditions” (AAIA, 2010). Ozone data is from Krueger and Minzner (1976).
The actual profiles vary primarily with time of day and latitude.
The purple line (15 km), red dotted line (25 km), and red dashed line (40 km) above show the altitudes for the same colored lines showing actinic flux (AF) in the figure below. Actinic flux is the quantity of radiation at a point in the atmosphere “used to calculate various photodissociation rates that are used to describe the photochemistry of the atmosphere” (Kylling et al., 2003).
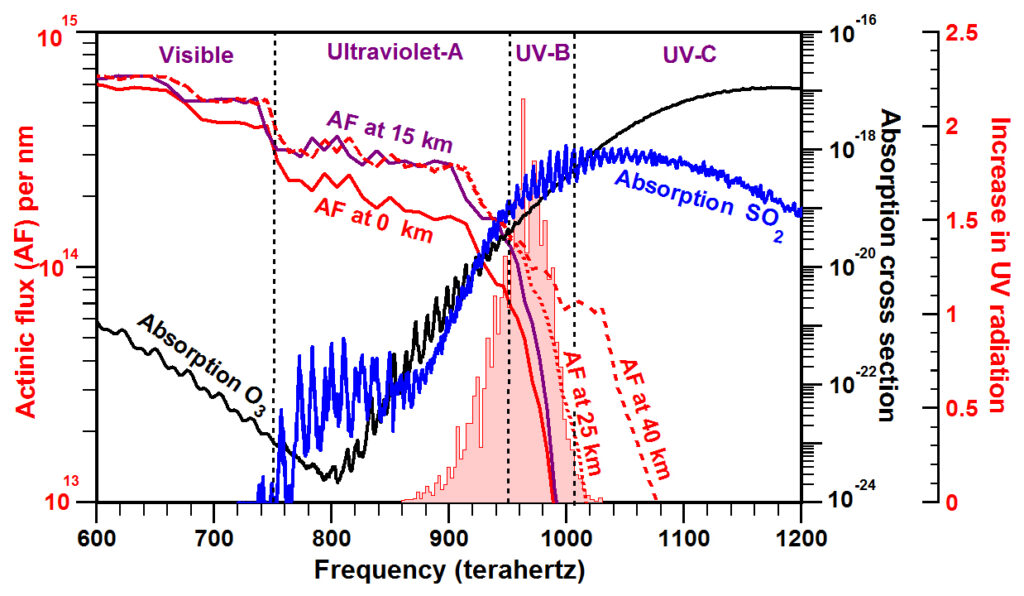
A 50% decrease in total column ozone increases the amount of ultraviolet radiation reaching Earth’s surface by ~2 W m-2 between 290 and 340 nm (red shaded area) when Sun is directly overhead (Madronich, 1993). O3 and SO2, absorb solar energy strongly at wavelengths <400 nm. Absorption by O3 typically leads to photodissociation for wavelengths <411 nm. Actinic flux is photons cm-2 s-1, absorption cross section is cm2 per molecule, and increase in UV radiation is mW m-2 nm-1. Absorption data for O3 from (Rothman et al., 2013) and for SO2 from Hermans et al. (2009) and Vandaele et al. (2009).