Mean Surface Global Temperature
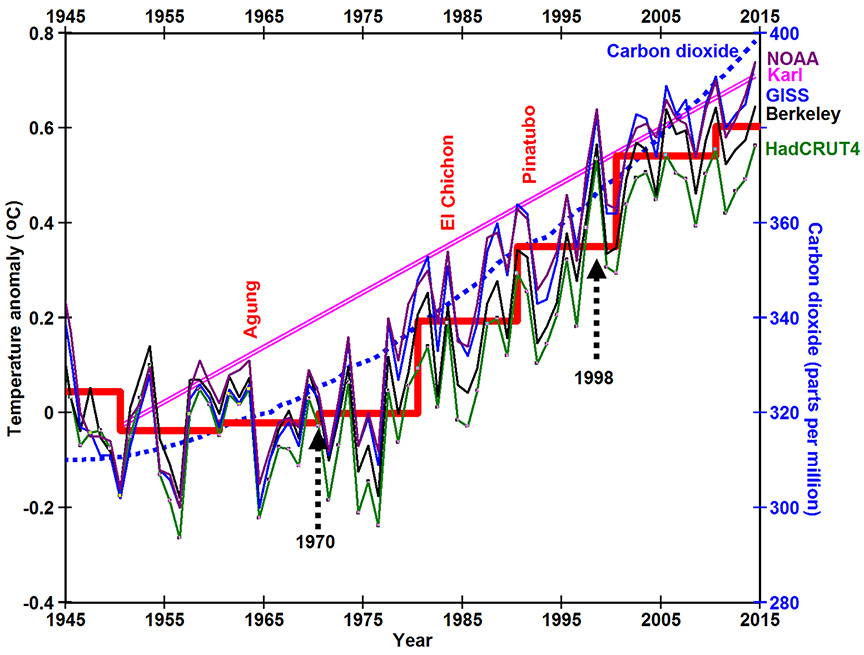
Mean annual surface global temperatures (red line) were essentially constant from 1945 to 1970, rose sharply to 1998, and have remained essentially constant since 1998 while concentrations of carbon dioxide (CO2) (dotted blue line) (NOAA, 2014) have risen continually at ever increasing rates. Solid lines show annual land-sea temperature data from different sources: black is Berkeley Earth, purple is NOAA, navy blue is GISS LOTI, and green is HadCRUT4. The red line shows the basic trend of the temperature data correcting for the cooling of up to 0.5oC for a few years that typically follows large explosive volcanic eruptions such as Agung (1963), El Chichón (1982), and Pinatubo (1991). One can argue whether the best fit for the data from 1945 to 1970 and from 1998 to 2014 are horizontal lines or lines with a slightly increasing or decreasing slope. But clearly the increase in temperature from 1970 to 1998 is much greater than before 1970 or after 1998.