Three Enigmas Led to This Research
The first enigma
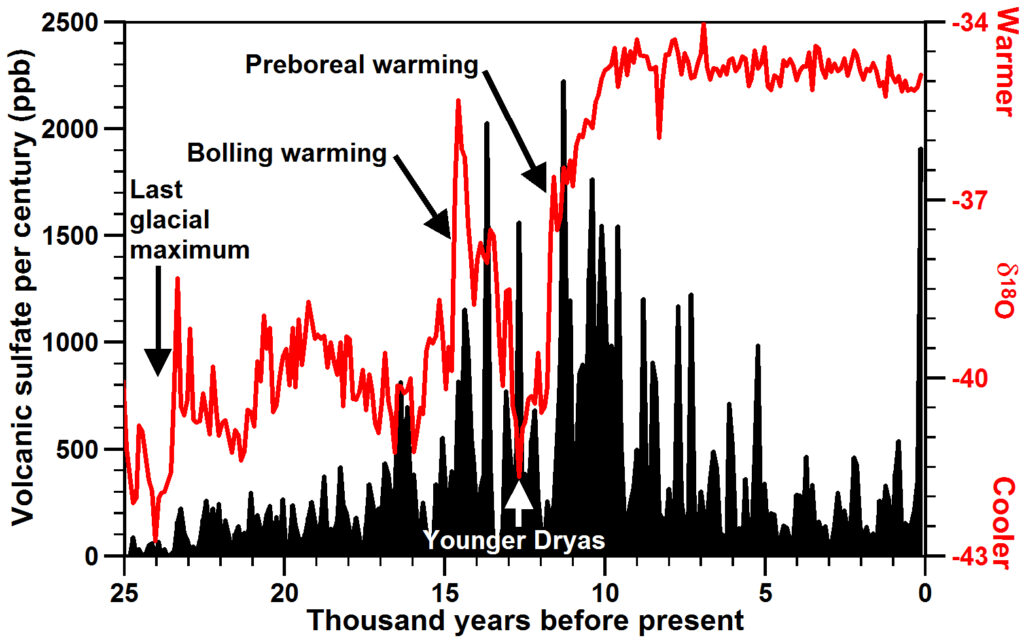
In late 2006, while working on something totally unrelated to climate, I discovered data from the Greenland Ice Sheet Project 2 (GISP2) through a paper by Zielinski et al. (1996) (Data, Volcanic markers) showing that since the end of the last ice age, the layers of ice below Summit, Greenland containing the greatest amounts of volcanic sulfate (SO42-) also contained oxygen isotope evidence (δ18O) for the greatest rates of global warming (White et al., 1997) (Data, Stacked). The chemical precursor to sulfate is sulfur dioxide (SO2) erupted in large quantities by volcanoes. These data appear to show that large amounts of volcanism was contemporaneous with the times of the greatest global warming in the past 25,000 years.
But all climatologists know that all major explosive volcanic eruptions described in written history have been followed by global cooling of approximately 0.5oC for up to three years. This cooling is readily explained by observations since the mid-20th century of large eruptions typically ejecting 5 to 20 megatons of sulfur dioxide into the lower stratosphere where the SO2 spreads around the globe within months and is oxidized into sulfuric acid (H2SO4). The sulfuric acid and water forms over time an aerosol with particle sizes large enough to reflect and scatter sunlight, thereby cooling Earth.
1) How can volcanic eruptions cause both global cooling and be contemporaneous with the greatest rates of global warming observed in the past 25,000 years?
I mentioned this question to some climatologists who said “well obviously there is something wrong with the sulfate data.” And the several scientists who published on these data did not seem the least bit concerned.
I spent the better part of a year examining these data in detail, even layer by layer. The data were collected meticulously by an outstanding team of scientists (GISP2). Sulfate can also be deposited from sea salt and continental dust. Mayewski et al. (1993 ) and Mayewski et al. (1997) applied an empirical orthogonal function (EOF) analysis to subtract these generally small contributions from total measured sulfate based on associated concentrations of sodium and calcium. This method is objective, based on sound chemical theory, and seems to provide a reasonably accurate estimate of the remaining “volcanic sulfate.” More than 63% of the 7000 measured ice layers formed in the past 25,000 years contained zero volcanic sulfate. The ratio of signal to noise is high: peak sulfate per century during peak warming (2028 ppb) is 218 times greater than average sulfate per century (9.3 ppb) during the last glacial maximum between 25,000 to 21,000 years before present and 441 times greater than average sulfate (4.6 ppb) between 5000 and 1000 years before present.
Changes in oxygen isotopes (δ18O) are widely accepted as proxies for paleotemperature in Greenland ice. The data in this figure include 16,600 samples collected among the same layers of ice as the sulfate minimizing errors in temporal correlation (White et al., 1997).
Layer by layer there is a close correspondence between increasing temperature and increasing sulfate, especially when high levels of sulfate occur in many contiguous layers. Each layer represents 2 to 3 years on average. Sulfate is greatest during the Bolling warming, decreasing during the cooler Younger Dryas, and increasing again during the Preboreal warming. Sulfate remained high in most ice layers formed from 11,500 to 9,500 years before present, implying relatively continuous volcanism as the ocean warmed out of the last ice age. I will show later that Iceland is dotted with basaltic table mountains or tuyas formed under glacial ice and that “12 of the 13 dated table mountains experienced their final eruptive phase during the last glaciation” (Licciardi et al., 2007). These data are hard to ignore.
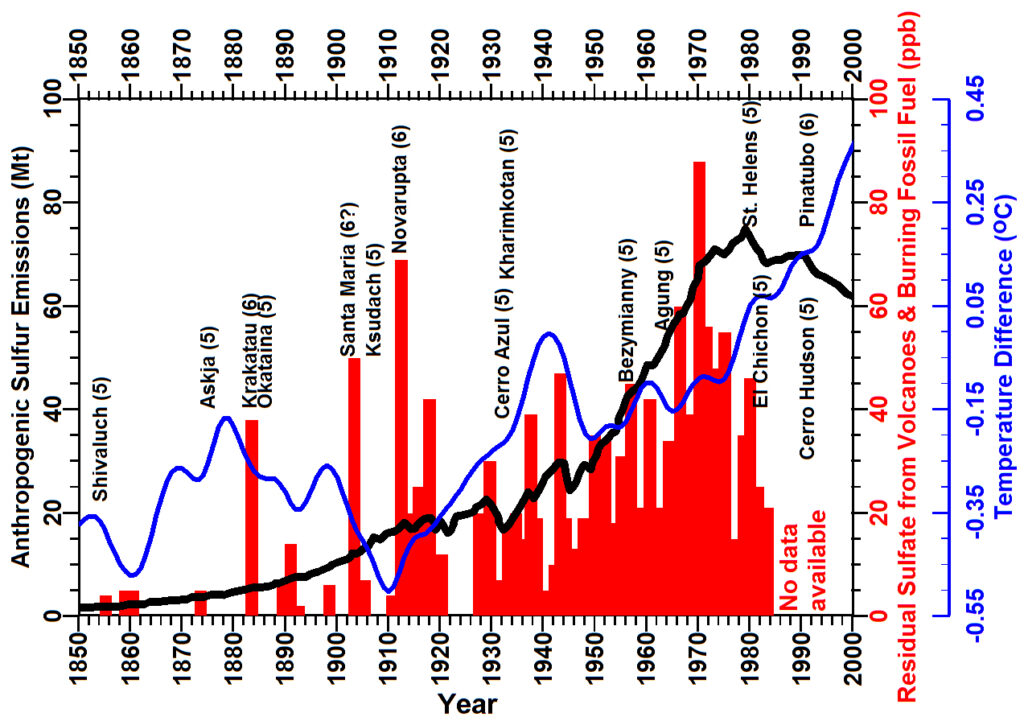
The red bars in this next figure show the amount of “volcanic sulfate” per layer from 1850 until 1984, near the top of the GISP2 ice core. There are peaks in amount of sulfate during each year that contains a volcanic eruption, labeled in black with a number in parentheses relating to the logarithm of size, the Volcanic Explosivity Index (VEI). Note that the mean level of sulfate per year correlates closely with the amount of sulfur emitted by humans burning fossil fuels (black line) (Smith et al., 2001) (Smith et al., 2004, pdf). The blue line shows the mean annual temperature in the Northern Hemisphere (HadCRUT3nh, 2013) expressed as the difference from the 1961 through 1990 mean temperature observed at the same station. The yearly values are smoothed with a seven point centered mean. Could 20th century warming be related to anthropogenic emissions of sulfur dioxide?
Based on all of these seemingly reliable observations, I became convinced that there was something going on concerning global warming that we do not understand and that understanding it might make an important contribution to a major scientific and political issue of our time. I decided to give up many other things that I was doing and to concentrate on trying to understand the primary causes of global warming. Many times since 2006, I have stepped back to try to assess objectively whether I was heading in the right direction. In each case I revisited the sulfate data from GISP2 and continued on, determined to explain these data.
The second enigma
As I dug deeper into greenhouse gas theory, I began to wonder how precisely heat can flow from a colder atmosphere to a warmer Earth. Greenhouse gas theory posits that greenhouse gases in the atmosphere can slow the rate at which Earth cools, much like a blanket and this appears to be true. The lapse rate, the rate that air temperature decreases with altitude above the Earth, averages 6.4oC per kilometer but decreases to 5.5oC per kilometer in wet air and can increase to 10oC per km in dry air. Heat, in matter at least, flows faster when the thermal gradient is larger. Increases in atmospheric water vapor, the primary greenhouse gas, do appear from direct observation to decrease the rate that heat flows away from Earth.
But it is also assumed in all radiation codes used to model climate change that layers of greenhouse gases radiate energy back to Earth, warming Earth. But layers of greenhouse gases are observed to be colder than Earth. How can radiation from a colder body, warm a warmer body? You do not stand around a cold stove to get warm.
2) How can layers of gas in the atmosphere that are colder than Earth, cause warming of Earth?
The third enigma
This led me to wonder: what is radiation and how, exactly; is radiant energy absorbed and radiated by molecules of gas. Spectral physicists describe in great detail how gas molecules absorb infrared radiation only at the precise resonant frequencies of the different degrees of freedom of motion between different atoms within the molecule and at the frequencies of the moments of inertia of the molecule itself. This means that the spectrum and amounts of energy absorbed are determined by the molecule, not by the energy contained in some photon traveling from Sun or Earth.
3) Is the photon a physical reality or is it just a very useful mathematical concept for a packet of energy extracted by a molecule from an electromagnetic field of radiation?
These enigmas have kept me up late at night, gotten me up early in the morning, and dominated my thinking for many years. Finally it has all begun to make sense.