GISP2 Sulfate 1850 to 2000
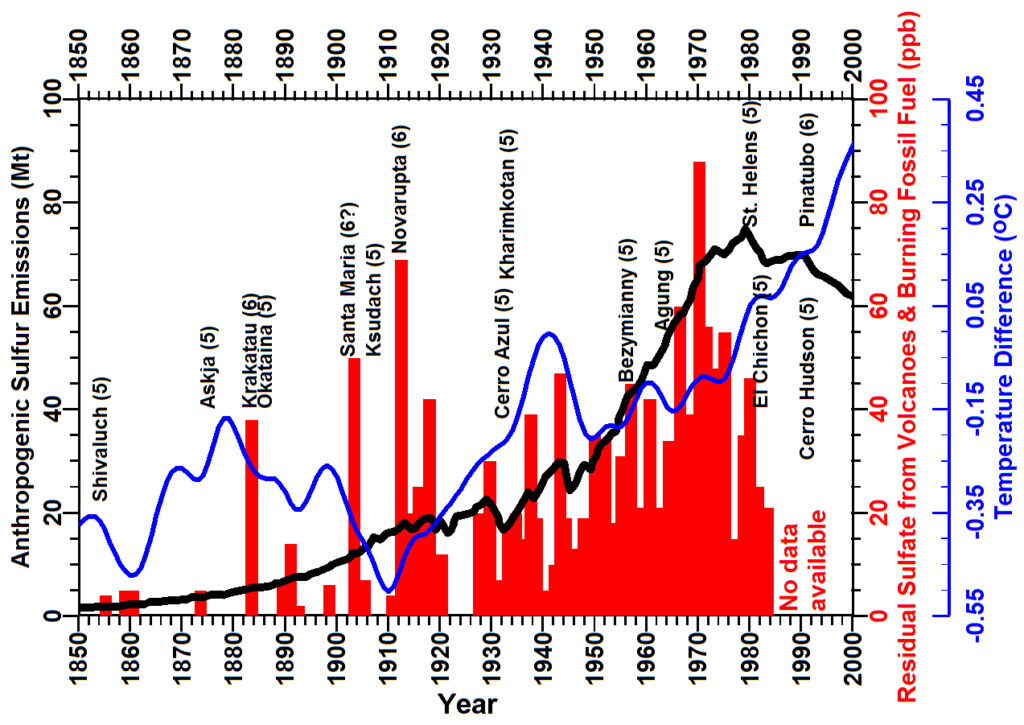
Recent warming correlates with increases in sulfur from fossil fuels. Red bars show sulfate in each layer of ice in Greenland (Zielinski et al., 1996) (Data, Volcanic markers), the blue line shows average global temperature (Brohan et al., 2006) (Data), and the black line shows sulfur emitted by burning fossil fuels (Smith et al., 2001) (Smith et al., 2004). Names of all volcanoes with Volcanic Explosivity Index (VEI) of 5 or larger are shown with VEI in parentheses (Global Volcanism Program, 2013). All layers since 1925 contain residual sulfate that increases yearly in proportion to the increase in anthropogenic sulfur emissions. Recent data are not available because drilling of GISP2 began in 1988 .