Annual mean total column ozone at Arosa, Switzerland
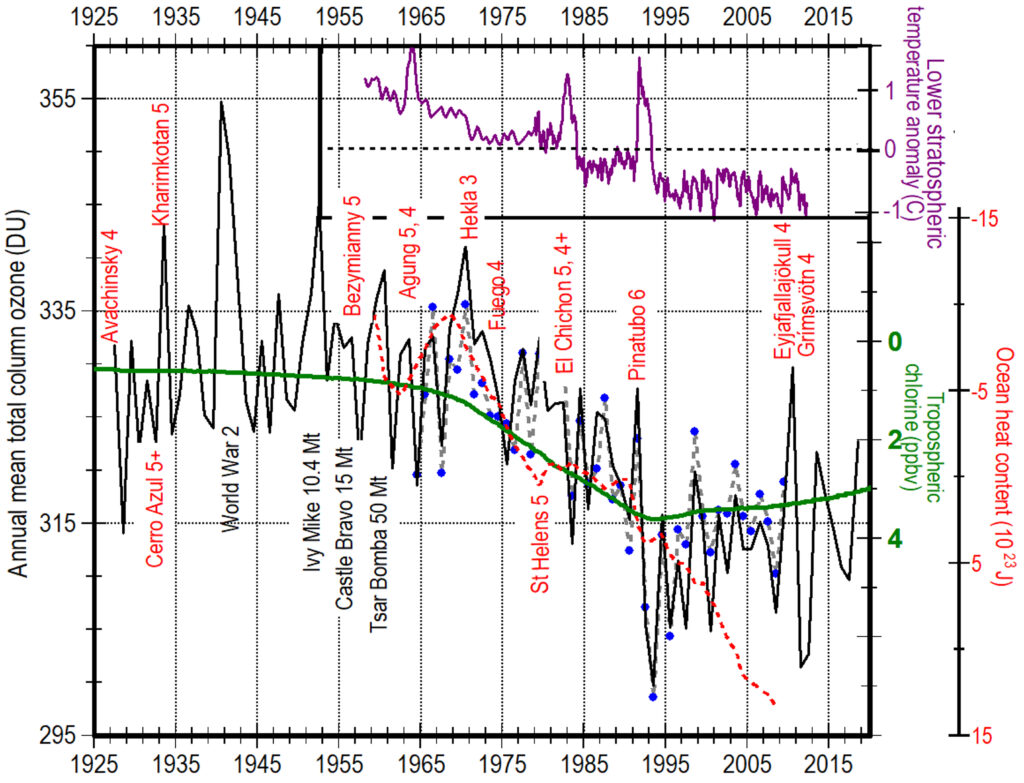
Annual mean total column ozone (black line) peaks during years with major volcanic eruptions and then drops precipitously by more than twice as much during the following year causing a cooling in the lower stratosphere (purple line). The ozone data were measured at Arosa, Switzerland (Maeder, 2013)(Data, year) (WOUDC, 2013). The names of the erupting volcanoes and the Volcano Explosivity Index (VEI) for each large eruption are labelled in red (Global Volcanism Program, 2013). The green line shows annual mean tropospheric chlorine with the y-axis inverted (Solomon, 1999). The dashed red line with the y-axis inverted shows increase in ocean heat content (Levitus et al., 2012). The purple line shows lower stratospheric temperature anomaly based on radiosonde data before 1979 (Hadley Centre, 2013) and satellite data since (Remote Sensing Systems, 2012), smoothed with a seven-month centered running mean.