Comments on the History of Greenhouse-Gas Theory
James Fleming provides a thoughtful, critical review of the history of greenhouse-gas theory in his book Historical Perspectives on Climate Change with the 2005 edition available online in PDF. Other reviews include Jones and Henderson-Sellers (1990), Mudge (1997), (Ramanathan and Vogelmann, 1997), Fleming (1999), Fleming (2007), Le Treut et al. (2007), Weart (2008), Jokimäki (2010), and Weart (2014).
Here we will focus on the boundary between observations that have driven interest in greenhouse gases and the assumptions that have been made at critical junctures throughout this history. Science has a history. Scientists build on what has come before, what they think has been proven beyond a reasonable doubt. In the development of greenhouse-gas theory, more doubt and more experimental studies would have been valuable.
The greenhouse-gas theory of global warming is based on the following primary observations that have become clearer over the past 155 years:
- Some specific frequencies of infrared radiation from Earth are absorbed by trace gases in the atmosphere, most notably water vapor, carbon dioxide, and methane (Tyndall, 1861) (Rothman et al., 2013).
- Concentrations of carbon dioxide in the atmosphere have increased 39% from around 285 parts per million by volume (ppmv) in 1850, the coldest part of the last cold phase of the Little Ice Age, to around 397 ppmv in 2014.
- In the past 800,000 years, concentrations of carbon dioxide have generally been lower than 190 ppmv during major glacial periods and higher than 280 ppmv during interglacials (Lüthi et al., 2008).
- Humans are currently adding 8.3 x 10¹⁵ grams (109 tons) of carbon to the atmosphere every year (IPCC, 2013, PDF) primarily by burning fossil fuels and producing cement.
- The world has generally been warming since the last cold phase of the Little Ice Age around 1850.
- Mean global surface temperatures rose 0.56oC from 1970 to 1998 while concentrations of carbon dioxide rose 12% from 326 ppmv to 364 ppmv.
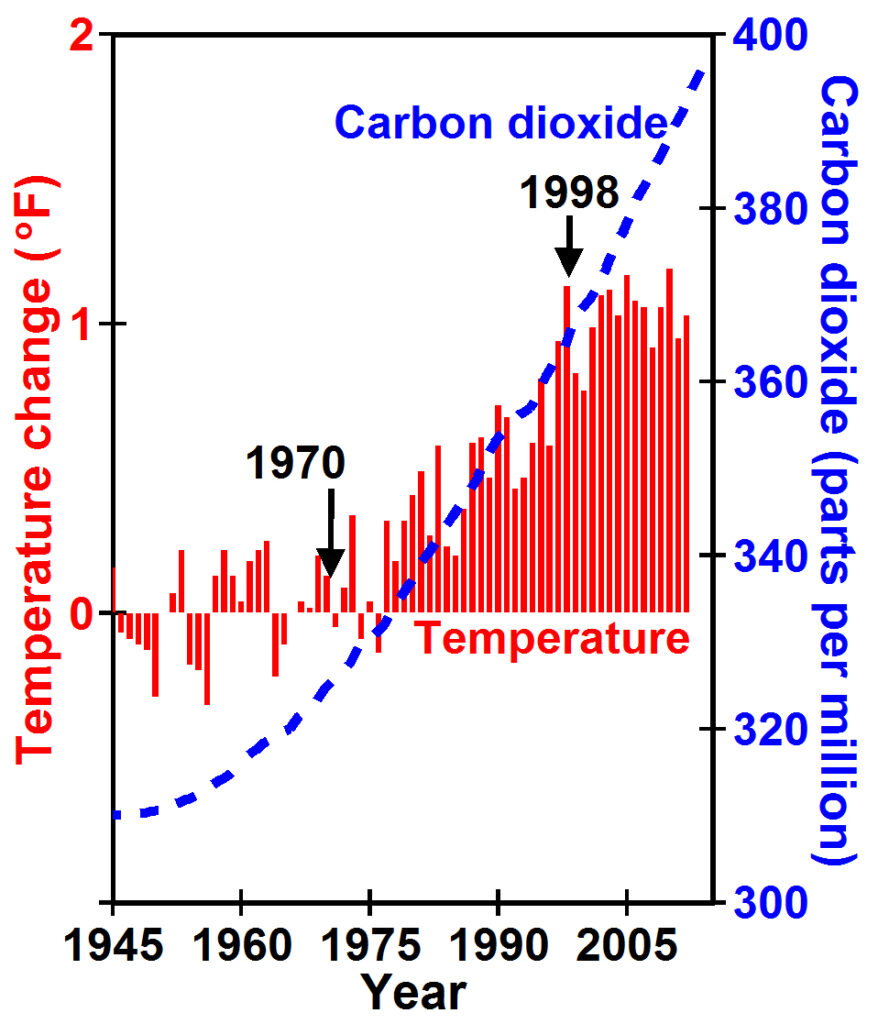
These observations suggest that concentrations of carbon dioxide increase and decrease more or less contemporaneously with mean global temperatures and that humans may be emitting enough CO2 to be causing current warming. But contemporaneity is not proof of cause and the global carbon cycle is complex so that only a portion of the emissions could cause warming. Mean global temperatures have increased very little since 1998 while atmospheric concentrations of CO2 have continued to increase at even higher rates since 1998 than they were increasing before 1998 (NOAA, 2014). This suggests that increasing temperatures are caused by something more than increases in atmospheric concentrations of carbon dioxide.
The flow of heat
In 1822, Joseph Fourier provided a mathematical basis for studies of heat with his book Théorie Analytique de la Chaleur (Fourier, 1822) (The Analytical Theory of Heat (PDF)), an elegant work that Lord Kelvin described as “a great mathematical poem” (Fleming, 1999). Fourier thought of his work as laying the foundation for studying heat much as Isaac Newton’s The Principia: Mathematical Principles of Natural Philosophy (1687) laid the foundation for classical mechanics. Fourier believed that the “profound study of nature is the most fertile source of mathematics.” He provides an excellent summary of observations of heat that form the physical basis for his equations. Some of his key concepts that we would do well to pay more attention to today include:
- “Heat, like gravity, penetrates every substance of the universe; its rays occupy all parts of space.” Radiation is simply the continuity of heat across the air or space between bodies of matter.
- Expressions representing “the motion of light in the atmosphere” also determine “the laws of diffusion of heat in solid matter.” Care is needed here because in matter heat inhabits the bonds that hold matter together while in space there is no matter and there are no bonds.
- A body loses heat to air by two means: “One is the heat communicated by way of contact to the surrounding air, the other, much less than the first, is the radiant heat emitted.” Earth’s surface loses much more heat to the troposphere via hot air rising and convection than via radiation affected by greenhouse gases.
- “Every surface which receives rays of heat from surrounding bodies reflects part and admits the rest.” Not all frequencies of heat are absorbed; some are reflected.
- “The rays which tend to go out of heated bodies are arrested at the surface by a force which reflects part of them into the interior of the mass.” Not all frequencies of heat are emitted.
- “The physical cause of the reflection of cold, that is to say the reflection of a lesser degree of heat, is very distinctly known.” (Pictet’s experiments in the late 18th century are described by Evans and Popp (1985)).
- “The rays of heat which escape from the surface of a body pass freely through spaces void of air; they are propagated also in atmospheric air: their directions are not disturbed by agitations in the intervening air.”
- “The action of heat tends to expand all bodies, solid, liquid or gaseous; this is the property which gives evidence of its presence.”
- “The quantity of heat which one of the molecules receives from the other is proportional to the difference of temperature of the two molecules.”
- “The radiation of the sun … penetrates the air, the earth, and the waters; its elements … would raise [Earth’s] mean temperature more and more, if the heat acquired were not exactly balanced by that which escapes in rays from all points of the surface and expands through the sky.”
The greenhouse effect
In 1681, Edme Mariotte discovered that solar radiation passes readily through glass while infrared radiation does not. In the 1760s, Horace Benedict de Saussure was struck by the observation “that a room, a carriage, or any other place is hotter when the rays of the sun pass through glass” (Butti and Perlin, 1980). He constructed the first documented solar oven or hot box where the sunlight passing through three layers of glass separated by confined air could heat a well-insulated box to 110oC, very useful for cooking many foods. Using this approach he developed the heliothermometer, an instrument for measuring the intensity of solar radiation using a black-bulb thermometer in an internally blackened glass covered case. He showed that the intensity of solar radiation high in the mountains was similar to the intensity on the plain, 4852 feet below, even though the air temperature was 20oC warmer on the plain than on the mountain.
Fourier had a strong interest in the flows of heat on Earth and noted that the thickness of the atmosphere and the nature of the surface determines the surface temperature on Earth but “it is difficult to know how far the atmosphere influences the mean temperature of the globe” (Fourier, 1824, p.153). He described Sassure’s heliothermometer explaining “the theory of the instrument is easily understood. It is sufficient to remark, 1st, that the acquired heat is concentrated, because it is not dissipated immediately by renewing the air; 2nd, that the heat of the sun has properties different from those of heat without light [infrared radiation]. The rays of that body [the sun] are transmitted in considerable quantity through the glass plates into all the intervals, even to the bottom of the vessel. They heat the air and the partitions which contain it. Their heat thus communicated ceases to be luminous, and preserves only the properties of non-luminous radiating heat [infrared]. In this state it cannot pass through the plates of glass covering the vessel. It is accumulated more and more in the interval which is surrounded by substances of small conducting power, and the temperature rises till the heat flowing in, shall exactly equal that which is dissipated” (Fourier, 1824, p.154).
In 1836, Claude Pouillet wrote a “Memoir on the solar heat, on the radiating and absorbing powers of the atmospheric air, and on the temperature of space” (Pouillet, 1836) (Click for translation). “Pouillet compared the atmosphere to experiments he had done on solid and liquid diathermanous screens, for example, panes of glass and layers of water, concluding that the atmospheric stratum acts in the manner of screens of this kind, and … exercises a greater absorption upon the terrestrial than on the solar rays” (Fleming, 1998, page 59).
Thus by 1836, the observation that terrestrial infrared radiation does not penetrate glass and is partially absorbed in the atmosphere provided a possible mechanism for global warming because solar energy may accumulate on Earth faster than infrared energy can leave Earth. This became known as the greenhouse effect, which is a misnomer because greenhouses are warmed primarily by Fourier’s first mechanism, limiting the dissipation of heat via convection.

Measuring absorption
In 1800, William Herschel discovered that in addition to visible light, sunlight included radiation below red (infrared) with frequencies less than 430 Terahertz and wavelengths longer than 0.7 micrometers (μm). In 1814, Joseph von Fraunhofer invented the spectroscope, an instrument that measures the intensity of light at different frequencies. He ultimately observed 574 dark lines in the solar spectrum that were shown by Gustav Kirchhoff and Robert Bunsen in 1859 to be caused by absorption of very precise frequencies of light by specific atoms in the atmosphere of the sun (Kirchhoff, and Bunsen, 1861). A few spectral lines of absorption in the near infrared have turned out to be due to oxygen (O2) molecules in Earth’s atmosphere. Tyndall (1861, p. 34-35, PDF) states “by Kirchoff it has been conclusively shown that every atom absorbs in a special degree those waves which are synchronous with its own periods of vibration.”
In early 1859, John Tyndall was the first scientist to devise experiments to investigate systematically which gases absorb infrared radiation (Tyndall, 1859, PDF). He developed the first ratio spectrophotometer shown in the figure. (Click on the figure for a detailed explanation of Tyndall’s laboratory setup.) Tyndall trapped the gas to be studied in a long brass tube capped at both ends with rocksalt through which infrared radiation would pass. Then using a thermopile, he measured the temperature change resulting from absorption by different gases. He discovered that infrared energy was absorbed by “compound gases” consisting of three atoms of two chemical elements such as water vapor (H2O) and carbon dioxide (CO2), but not by gases with only one element such as nitrogen (N2), oxygen (O2), and argon (Ar) that make up 99.97% of air in Earth’s atmosphere (Tyndall, 1861, PDF) (Tyndall, 1872). Tyndall concluded that water vapor was the strongest absorber of radiant heat of any atmospheric constituent and was the most important gas for controlling the surface temperature of Earth. This is clearly demonstrated today by the observation that the lapse rate in the troposphere is 5.5oC/km for a wet atmosphere and 10oC/km for a dry atmosphere.
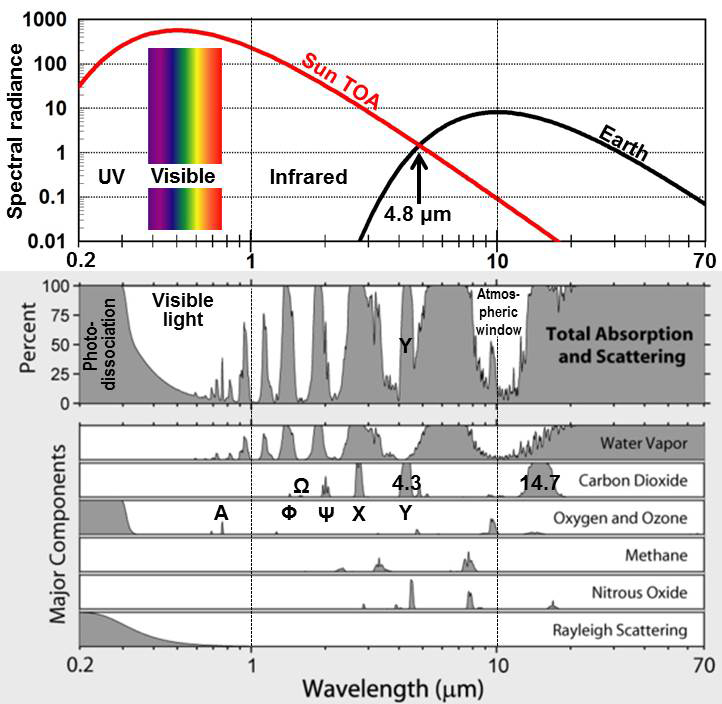
In the early 1860s, Kirchhoff defined a black body as a perfect absorber and emitter of radiation that emits a continuous spectrum of radiation. In 1900, Max Planck was able to create an equation empirically to approximate the spectral radiance, the amount of radiance at each frequency, observed to be emitted by such a black body as a function of temperature. The figure to the left shows the results of Planck’s law for the spectral radiance from Earth assuming an absolute temperature of 288K (black line) and from the sun assuming a temperature of 5770K (red line) (Harder et al., 2009) as it would be measured at the top of Earth’s atmosphere (TOA) correcting for the divergence of sun’s rays. Also shown are the bands of absorption for different greenhouse gases based on current knowledge (Rohde, 2007).
A is the Fraunhofer line at 0.75937 μm caused by absorption by O2. This line is just beyond the spectral range of visible light (0.39 to 0.7 μm). Visible light can be spatially dispersed by a glass prism into individual colors and the spectral radiance can then be measured for each color. Infrared radiation with wavelengths greater than 0.7 μm, on the other hand, is absorbed by glass but can be dispersed by a prism made of rocksalt.
Samuel Pierpont Langley invented the actinic balance (Langley, 1881) in 1878 that became known as the bolometer (Langley, 1898), an instrument to measure the power of incident electromagnetic radiation by heating a material with a temperature-dependent electrical resistance. He used this balance to measure attenuation of solar radiation for wavelengths up to 3 μm, discovering absorption peak X at 2.6 μm (Langley, 1883) and then up to 5 μm, discovering absorption peak Y at 4.3 μm (Langley, 1888). Measuring Fraunhofer line A had been difficult, but the spectral radiance of sun TOA at 4.3 μm is 162 times smaller. So Langley measured radiation from the moon that had more spectral radiance at infrared wavelengths. Also note that the spectral radiance of sun TOA equals that from Earth at wavelengths around 4.8 μm so Rubens and Aschkinass (1898) turned to measuring absorption by carbon dioxide in the laboratory to define the broadest absorption peak from 13 to 17.5 μm (labeled 14.7). Also note that for all absorption peaks at wavelengths less than 4.8 μm, there is more spectral radiance from the sun than from Earth (Lecher, 1881).
By the end of the 19th century, a number of rather sophisticated and precise studies of atmospheric absorption were being done by several scientists in the United States and Europe including Langley, Rubens and Aschkinass (1898), Ångström (1892), Paschen (1894), and Very (1900). They established that carbon dioxide does absorb a small amount of terrestrial infrared radiation primarily in the wavelength bands with highest spectral radiance around 4.3 μm (Y) and 14.7 μm. Spectral radiance was measured as the temperature change caused by radiation heating matter within a sensor. Thermal energy was thought of as a function of bandwidth as expressed clearly by Langley (1889, page 424):
The reader is reminded that the words “infra-red” have obtained an extension of meaning since we have been able to show in previous memoirs, not only the vast amount of the energy in this region (which, in the case of the sun, is over 100 times that in the ultra-violet,) but that in this invisible infra-red there is every variety of condition, greater differences than there are e. g. between violet and orange light, and that Melloni’s anticipatory comparison of varieties of radiant heat to varieties of color actually understates the truth.
In 1884, William Ferrel, a mathematically astute meteorologist, developed equations relating the spectral radiance from the sun at different latitudes to mean surface temperature at those latitudes. He wrote (Ferrel, 1884, p. 20-21):
Where the body is surrounded by a diathermanous envelope … as … the earth surrounded by its atmosphere, the conditions determining the rate of losing or gaining heat and the temperature of the body, do not depend merely upon the radiating or absorbing powers of the body, but likewise upon those of the diathermanous envelope. The radiated heat of the body in passing through the envelope surrounding it is partly absorbed by it, and the part absorbed being again radiated in equal parts, back toward the body and out from it, one-half the absorbed heat is returned and only the other half escapes through the envelope. The same is the case with the part irregularly reflected in all directions. One-half of these likewise come back to the body and the other half escapes. The effect, therefore, of the envelope is to hinder the escape of heat radiated by the body and to retard the rate of cooling.
These words are based on logic, not experiment, and they make many assumptions including:
- Radiation absorbed by a gas molecule is re-radiated. We know now that the energy absorbed increases the energy of internal oscillation of the bonds of the molecule and is not re-radiated unless electronic transitions are involved, which they are not for nearly all frequencies of infrared radiation.
- Gas radiates energy like a blackbody. Gas is not a blackbody because it only absorbs the resonant frequencies of the bonds holding certain molecules together.
- Radiation flows equally in all directions. But radiation, just like heat, flows from hot to cold.
- Radiation is absorbed by all matter, but radiation colder than matter is reflected by the matter.
Yet this simple logic, expressed so clearly by William Ferrel in 1884, has lived on to be expressed by most climatologists today and to be incorporated in current radiation codes.
Origin of the ice ages
Tyndall, an avid mountaineer experienced with alpine glaciers, suggested that the observed absorption by water vapor and carbon dioxide “may have produced all the mutations of climate which the researches of geologists reveal” (Tyndall, 1861, p. 29). In 1864, the geologist James Croll suggested that glacial epochs might be caused by changes in Earth’s orbit (Croll, 1864). With publication of Croll’s book in 1875, the existence of ice ages was beginning to be accepted and debates about their origin intensified. Svante Arrhenius founded the Stockholm Physics Society in 1891 where “very lively discussions on the probable causes of the Ice Ages” in 1894 piqued Arrhenius’s interest, causing him to spend most of 1895 calculating a model based on changes in atmospheric concentrations of CO2. In 1896, Svante Arrhenius published a paper arguing that “the temperature of the Arctic regions would rise about 8o to 9oC, if the carbonic acid [carbon dioxide] increased to 2.5 to 3 times its present value. In order to get the temperature of the ice age between the 40th and 50th parallels, the carbonic acid in the air should sink to 0.62-0.55 of present value (lowering the temperature 4°-5° C)” (Arrhenius, 1896, PDF). He calculated that a geometric increase in CO2 concentration would lead to an arithmetic progression in temperature. Arrhenius’s work was simply theoretical making many assumptions and simplifications. He relied heavily on a memoir by Arvid Högbom, a geologists and friend, who argued that over geologic time, there must have been enormous variations in carbon sources and sinks, resulting in increases and decreases in concentrations of CO2. He also relied on an analysis by Luigi De Marchi evaluating all known explanations for ice ages and concluding that “change in the transparency of the atmosphere would possibly give the desired effect” (De Marchi, 1895).
Arrhenius’ paper (Arrhenius, 1896, PDF) is often referred to today as the founding paper of greenhouse-gas theory. Arrhenius was a good scientist, receiving the Nobel Prize for chemistry in 1903 as one of the founders of the science of physical chemistry. But this paper was done in great haste, only 13 months from inception to publication and the paper is not well formulated Crawford (1997). Arrhenius built his model on observations by Langley cited above and admits that he did not have any direct observation for wavelengths greater than 9.5 μm, which includes the primary absorption peak from 13 to 17.5 μm (14.7) published two years later by Rubens and Aschkinass (1898) and includes the atmospheric window where infrared radiation passes through the atmosphere with little absorption. “Arrhenius’ final results are impressive both as an innovative exercise in model-building and as a first approximation of the influence of CO2 on climate. This should not make one forget, however, that they hardly rested on solid empirical ground. Arrhenius did not heed Langley’s warning that his investigation had yielded ‘no conclusion which we are absolutely sure of’ ” (Crawford, 1997).
Measuring the thermal effects of absorption
Knut Ångström taught physics at nearby Uppsala University focusing his research on the absorption of radiation by Earth’s atmosphere. Ångström (1900) (Click for English translation) describes the following observations:
- At 3252 meters above sea level on Pico de Teide on Tenerife in the Canary Islands, “not 1.5% of the radiation was absorbed by carbon dioxide in the tube of his apparatus”.
- “The absorption capacity of carbon dioxide in the band Y [4.3 μm] is so strong that the relevant absorption is already saturated before the radiation arrives to us, and as for the weaker band X [1.7 μm], then the effect is similarly not noticeable because the absorption bands overlap the absorption bands for water vapor.”
- “We cannot assess yet, how big absorption by carbon dioxide is in the higher parts of the atmosphere.”
- Plotting “energy curves” and including liberal estimates of absorption at 4.3 μm and 14.9 μm, Ångström concludes for “an absolute temperature of the heat source of approximately 196o, … the absorption amounts to 10 to 16 percent. For a heat source of 100o[C], the absorption amounts to 12.5 to 19 per cent, a little more than the first-mentioned, as also the absorption band λ = 4.18 μm comes into effect.”
- From laboratory measurements “no more than about 16 percent of earth’s radiation can be absorbed by atmospheric carbon dioxide, and secondly, that the total absorption is very little dependent on the changes in the atmospheric carbon dioxide content, as long as it is not smaller than 0.2 of the existing value.”
- From “spectral bolometric investigations of the infrared spectrum during the winter of 1899/1900”, Ångström concludes that “the absorption of water vapor … is approximately 15 to 27 percent of the total radiation between the wavelengths of 0.3 to 4 μ. This must be considered as a minimum value of the absorption of atmospheric water vapor, because the parts of the solar spectrum of wavelengths larger than λ = 4 μ have been not included.”
Ångström argues that Arrhenius’ use of Langley’s data “can only give rather uncertain results because the difficulties multiply significantly when absorption bands of two different elements, in this case water vapor and carbon dioxide, are one on top of the other and therefore it depends on the separation of the two. … The Earth’s atmosphere would, according to Mr. Arrhenius, even if it is as dry as possible, absorb about 60 percent of earth radiation. The changes in absorption would be colossal with increases in carbon dioxide and a large enough carbon dioxide layer would even fully absorb terrestrial radiation …. Mr. Arrhenius also believes that these findings might be a cause for an ice age. To go into more depths of these findings, which were further developed by Mr. Ekholm [N. Eckholm, Die Zeitschrift “Ymer” 1899], does not seem appropriate as stated above.”
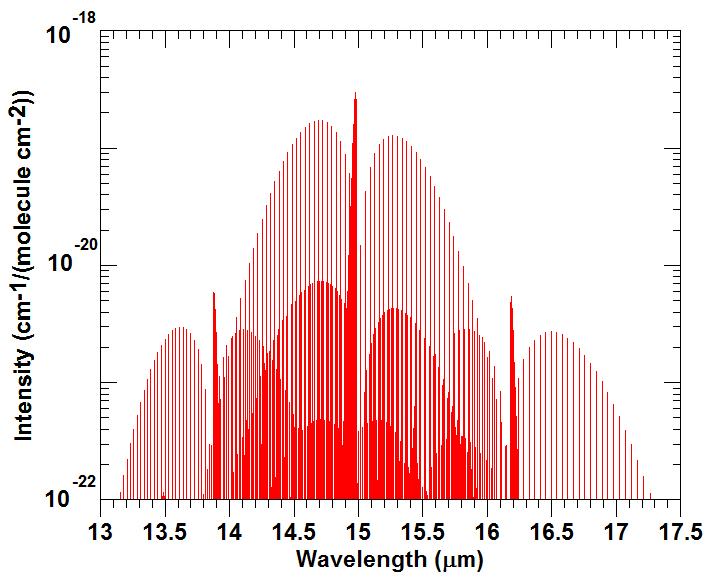
While Arrhenius responded (Arrhenius, 1901), Ångström’s paper in 1900 and two more in 1901 ended speculation about CO2 causing ice ages despite the enthusiasm of Nils Ekholm (1901), lifelong friend of Svante Arrhenius. While Thomas Chamberlin had embraced Arrhenius’ work with some enthusiasm (Chamberlin, 1897) (Chamberlin, 1899), after Ångström’s paper in 1900 “he repeatedly expressed his regrets that, following Arrhenius’s lead, he had jumped too hastily into the issue” (Fleming, 1998, p. 90). The possibility was revisited, for example by (Hulburt, 1931), but by 1930, the orbital theories of Milutin Milanković had grown in popularity. The absorption peak for carbon dioxide around 14.7 μm actually consists of many, very narrow spectral lines (Rothman et al., 2013).
Ångström’s paper also ended efforts by physicists to quantify absorption of terrestrial or solar radiation by water and CO2 through observation or experiment. By the 1930s, spectral physicists had developed theory and laboratory equipment adequate to show that absorption occurs in narrow spectral bands and on very narrow spectral lines within those bands (for example Martin and Barker, 1932) and therefore absorption would be a much lower percentage than Ångström calculated. Spectral physicists also showed that the overlap of spectral lines between CO2 and water vapor is minimal. Saturation of absorption of CO2 has also been contested (Augustsson and Ramanathan, 1977) (Weart and Pierrehumbert, 2007) (Pierrehumbert and Weart, 2007) but not resolved by experiment.
Ångström’s paper was well known in 1900. It convinced most scientists at the time that changes in concentrations of carbon dioxide were unlikely to have caused the ice ages and it caused most experimental physicists to focus their attention elsewhere (for example, Abbot and Fowle, 1908, PDF). But Ångström’s paper has largely gone unnoticed since. As of March 2014, Google Scholar lists only eleven references to this paper and nearly all are by historians of science. If absorption of infrared radiation by carbon dioxide actually causes warming of air, this should be measurable and quantifiable in the laboratory. Such experiments are not trivial, but should be well within the domain of experimental physicists. Yet I have been unable to find any paper in the literature documenting such an experimental effort. While the sensitivity of climate to a doubling of carbon dioxide may be affected by many feedbacks, the basic physical effect should be demonstrable in the laboratory.
There are many assumptions inherent in greenhouse-gas theory that should be amenable to experimental verification and quantification; these questions should be answered:
- When air containing trace amounts of CO2 is subjected to infrared radiation, is the air warmed and by how much?
- What are the effects on temperature of doubling or halving the concentration of CO2?
- Does the capacity of such air to absorb infrared radiation saturate with increasing amounts of CO2 or water vapor?
- How can the thermal effects of small changes in 0.04% CO2 on atmospheric warming be more important than the large changes in water vapor, which range over 0 to 5% of the atmosphere and that absorb over a much broader spectrum?
- Does cold gas radiate? Can gas be considered a black body?
- Can radiation from a colder black body warm a warmer black body?
- How does radiation pass through “layers” in the atmosphere?
- Are each of the assumptions used to write radiation codes for climate models verified by laboratory experiments?
In recent years, each of these issues has been addressed theoretically based on theory developed in the 19th century that has not been verified experimentally.
The energy in radiation
1900 was a pivotal year for another key piece of the puzzle: What is the energy of radiation? This is explained in much more detail at The Primary Problem with Greenhouse Gas Theory.
In 1900, Max Planck was able to create an equation empirically to approximate the spectral radiance, the amount of radiance at each frequency, observed to be emitted by a black body as a function of absolute temperature. At the time, spectral radiance was measured using a thermopile or a temperature sensitive resistor (bolometer). Thus spectral radiance was measured as the thermal effect that radiance at each frequency had on matter within the sensor, not the amount of radiation at each frequency. The change in temperature was thought of in terms of energy (watts which are joules of energy per second). But to create his equation empirically and ultimately to derive his equation from physical principles, Planck had to postulate that energy (E) in radiation equals frequency (ν, Greek letter nu) times a constant (h) ultimately known as the Planck constant. E=hν is used in equations for photochemistry to designate the energy that must be added typically from the sun in order to cause a given photochemical reaction. We all know from experience that visible sunlight feels hotter (more energetic) than infrared radiation, that ultraviolet radiation is hotter (more energetic) than visible light because it burns our skin, and that X-rays have much more energy than ultraviolet radiation because they penetrate our bodies but can destroy our bodies when doses are high. Greenhouse-gas theory discussed above, is based in part on the observation that infrared radiation is not energetic enough to penetrate glass.
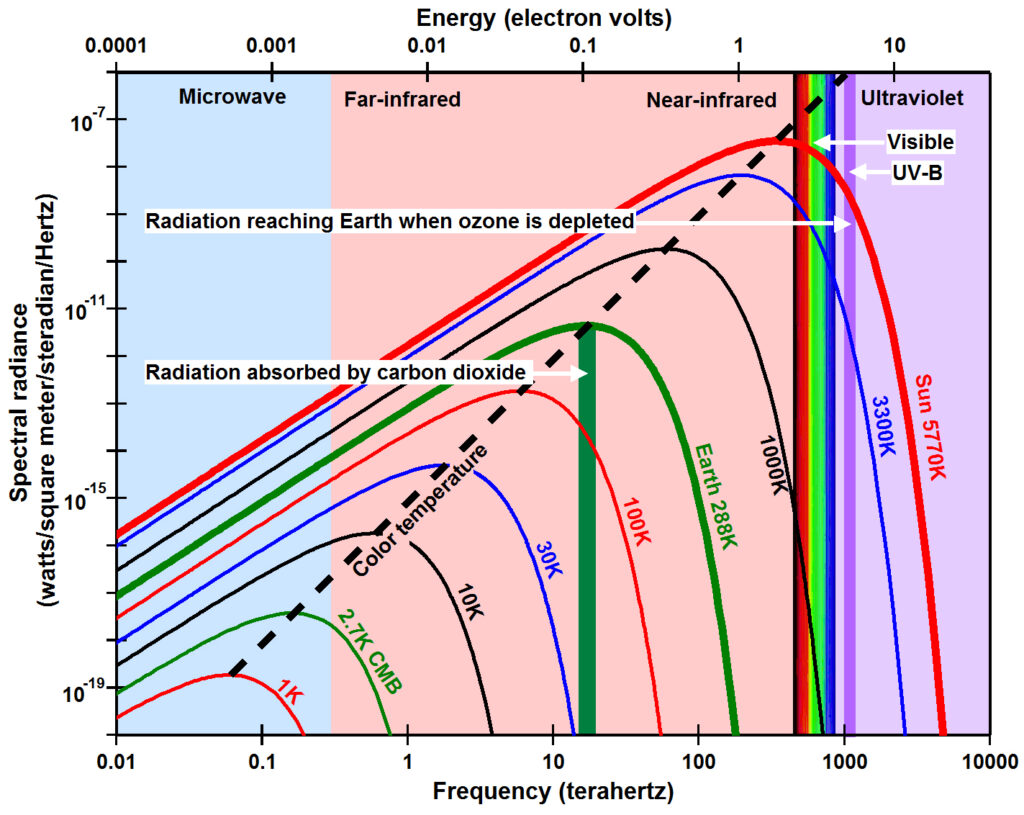
The Planck postulate, E=hν led to Albert Einstein’s light quantum (Einstein, 1905) (Click for English translation) and Gilbert Lewis’s photon (Lewis, 1926) and is fundamental to modern quantum physics. But what it says is that energy in joules or electron volts should be plotted on an alternate X-axis as shown in the figure to the left and that the Y-axis should not contain units of watts (joules per second). This means that the energy of the peak in spectral radiance from Earth has an energy of 0.1 electron volts with a radiation temperature of 288K (green vertical bar) while the energy of ultraviolet radiation that reaches Earth when ozone is depleted has an energy of 4 electron volts with a temperature of 16,500K (violet vertical bar). Contrary to what Langley (1889, page 424) concluded above, the energy in the infrared radiation absorbed by carbon dioxide at 14.7 μm is 48 times less than the energy in ultraviolet radiation reaching Earth when ozone is depleted. Energy in radiation is a function of frequency, not bandwidth. All models used in climate change today assume energy is a function of bandwidth and this is the primary problem with greenhouse-gas theory.
Max Planck was a leading theoretical physicist of his time. He received the Nobel Prize in Physics in 1918 “in recognition of the services he rendered to the advancement of Physics by his discovery of energy quanta” (E=hν). He was Professor of Physics at the University of Berlin from 1892 to 1926. He was editor of Annalen der Physik, a leading physics journal of the time, first as associate editor from 1895 and then as the editor for theoretical physics from 1907 to 1943. It was Planck who recognized Einstein’s genius and published his papers. Planck is widely recognized as the father of modern physics. The fact that he recognized that energy in radiation equals frequency times a constant but would then plot energy as a function of energy in his widely accepted and utilized Planck’s law shows how deeply ingrained the wave theory of light was at the time and the thought that brightness or intensity measured as the temperature increase in matter caused by radiation was energy. This misunderstanding is still dominant today.
The rebirth of global warming
After 1900, there were a small number of papers supporting “the carbon dioxide theory of the ice ages”, for example Hulburt (1931), and providing more detail about the absorption spectrum of carbon dioxide, for example Martin and Barker (1932). But according to Fleming (2007), it was the work of Guy Stewart Callendar, a British steam engineer, who heated up the modern concern about global warming Callendar (1938). In many papers between 1938 and 1961, Callendar argued that man was emitting millions of tons of carbon dioxide by fuel combustion and that this should cause a warming close to what was being observed Callendar (1938) (Callendar, 1940) (Callendar, 1941) (Callendar, 1949) (Callendar, 1958) (Callendar, 1961). Callendar’s model was based on better absorption data than Arrhenius but it was not based on improved experimental observations. In fact, Callendar never referenced Knut Ångström’s work.Gilbert Plass became an instructor in Physics at Johns Hopkins University in 1946, working with John Strong on pressure broadening of spectral lines (Strong and Plass, 1950). While on sabbatical in 1954-1955 at Michigan State University, he gained access to a large digital computer and worked on one of the first digital programs to evaluate a radiative transfer model. In five papers published in 1956, Plass focused attention on the possibility that “the infrared absorption properties of carbon dioxide, water vapor, and ozone determine our climate to a large extent” (Plass, 1956)(Plass, 1956)(Plass, 1956)(Plass, 1956)(Plass, 1956)(Plass, 1959)(Plass et al., 2010).
Plass’s work focused attention on the need to understand better how the ocean absorbs carbon dioxide, attracting the attention of geochemists Harmon Craig, Roger Revelle, and Hans Suess (Craig, 1957) (Revelle and Suess, 1957), ultimately leading to Appendix Y4: Atmospheric Carbon Dioxide of the Report of The Environmental Pollution Panel of the President’s Science Advisory Committee (1965). This report concluded that “man is unwittingly conducting a vast geophysical experiment” and that “the climatic changes that may be produced by increased CO2 content could be deleterious from the point of view of human beings.”
The development of the science of global warming since 1965 is described in considerable detail by Weart (2014) and elsewhere. The rapidly expanding volume of very impressive work and development of quite sophisticated computer models was driven by a genuine concern for the safety of humanity and other life on Earth. But it is built on concepts concerning radiation (what it is, how it is emitted and absorbed, and mathematical models for the effects of absorbing radiation on atmospheric and Earth temperatures) first described in the late 19th century. Many of these basic concepts have not been rigorously tested in the laboratory or in the field since the initial efforts by Ångström (1900). There have been numerous studies of climate sensitivity, but these typically begin by assuming the observed warming was caused by greenhouse gases and then attempting to quantify it (Stocker et al., 2013) (PALEOSENS Project Members, 2012).
What surprises me most is how little attention has been paid to the net heat involved in greenhouse gases. From Planck’s law, it is clear that temperature in matter involves a broad spectrum of frequencies, only a small portion of which are absorbed by greenhouse gases. The energy absorbed by greenhouse gases increases the amount of internal oscillation at the resonant frequencies of the absorbing molecules. Infrared energy is not sufficient to cause electronic transitions, which means that this internal energy is not re-radiated by fluorescence or other mechanisms. It is assumed to be shared through collision with all the other molecules contained in air, increasing the mean velocity of all molecules, and thereby increasing the temperature of the air. But molecules that absorb infrared radiation make up less than 400 ppmv of air, so the net increase in temperature across all molecules is quite small. The energy that reaches Earth when ozone is depleted, on the other hand, causes photodissociation of ozone in the lower stratosphere, causing the atomic and molecular pieces of ozone to fly apart are great velocity, increasing the temperature of the air directly. This warming is clearly observed in the lower stratosphere and is observed to decrease when ozone is depleted. When this energy reaches Earth, it is 57 times hotter (16,500K) than Earth (288K) and thus can warm Earth substantially. As described under Climate Trends, absorption by many pollutants preceded increases in temperature by up to 30 years, too long to be a likely cause of the warming. It is not completely clear that absorption of infrared radiation by any gas molecules can have a major effect on the temperature of Earth’s atmosphere or the temperature of Earth’s surface.