GISP2 Volcanic Sulfate from 22 to 46 Ka
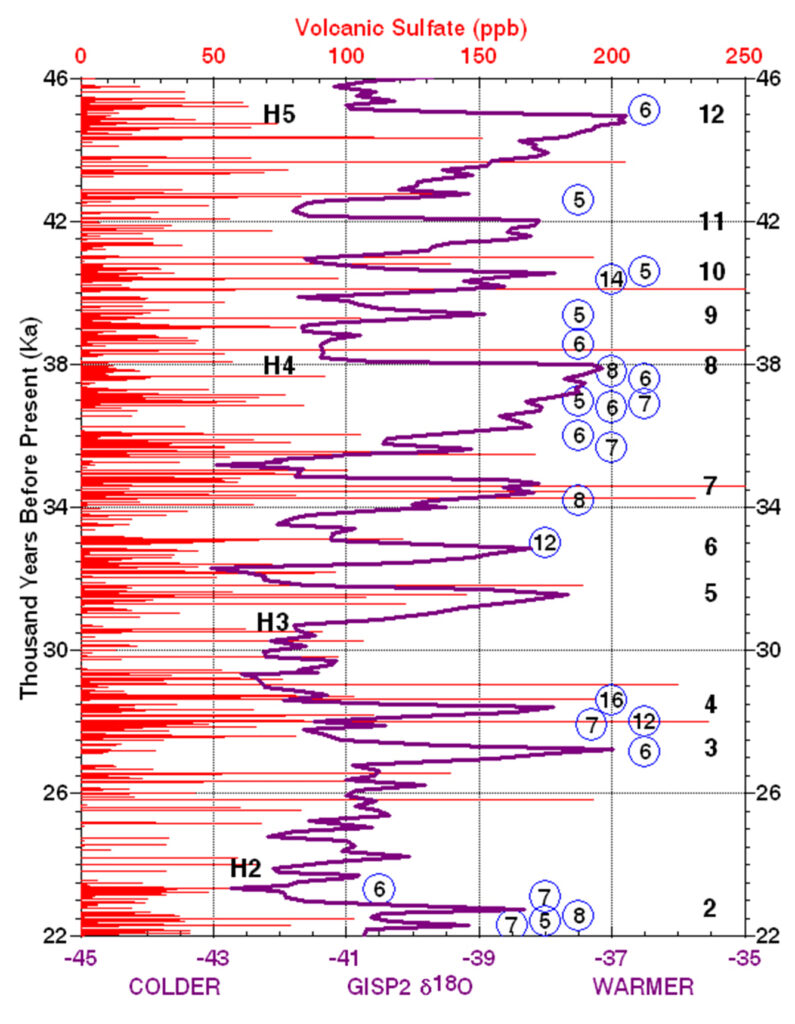
Dansgaard-Oeschger sudden warming events (numbers on the right side) all correspond to times of continuous volcanism. Red bars show the amount of sulfate in individual layers of ice in the GISP2 borehole. The purple line shows the δ18O proxy for temperature adjusted for gas age. Numbers in blue circles show the number of contiguous layers containing sulfate anomalies at the time plotted. H2 to H5 are Heinrich events when large numbers of icebergs suddenly appeared in the northern Atlantic Ocean.