Total Column Ozone and Minimum Temperature Above Toronto, Canada
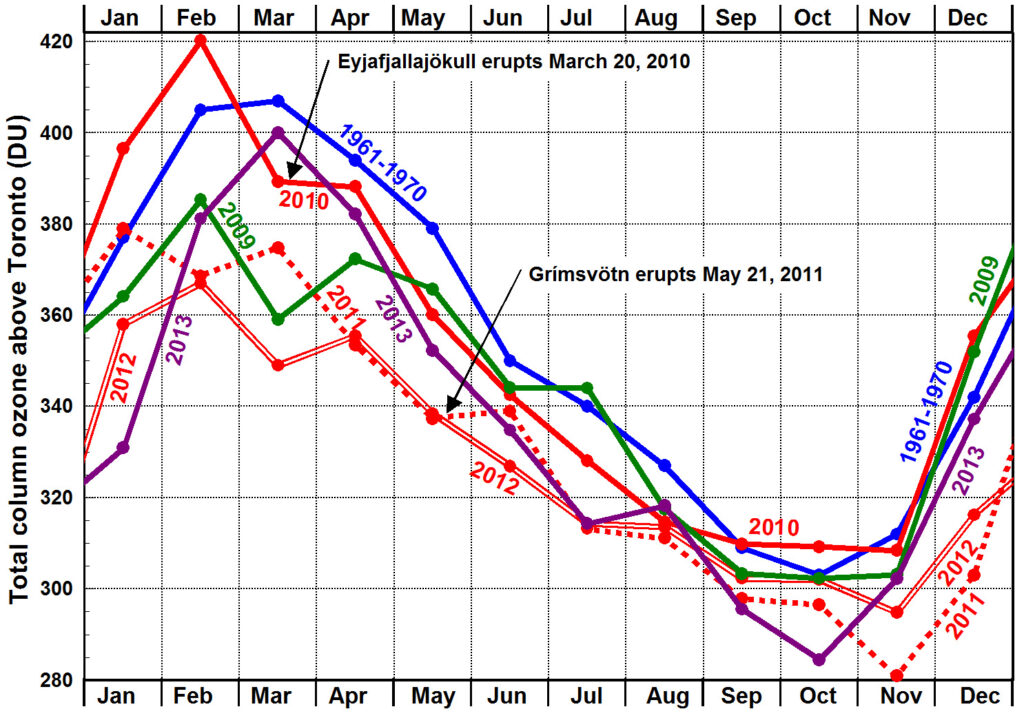
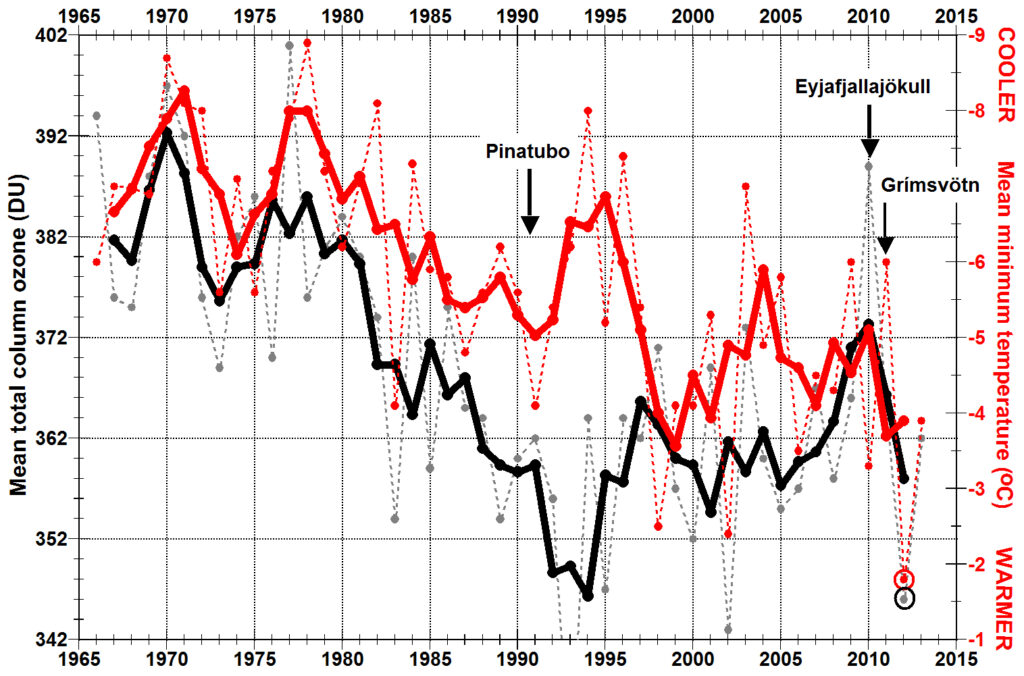
Ozone reached a minimum in 2012 when temperatures reached a maximum. Left: Total column ozone above Toronto, Canada, in November, 2011, was 12% below the average for Novembers in 1961 through 1970 and has remained unusually low throughout 2012. Right: When mean total column ozone measured during the months of December through April in Toronto Canada (black line) decreases, mean minimum temperature for the same months typically warms except following the eruption of Pinatubo (red lines, y-axis inverted). Ozone data measured at Environment Canada and the University of Toronto (WOUDC, 2013). Temperature data measured at Toronto International Airport (Environment Canada, 2013). The dashed lines show annual means; the solid lines are smoothed using a 3-point centred running mean.