Tropopause Height
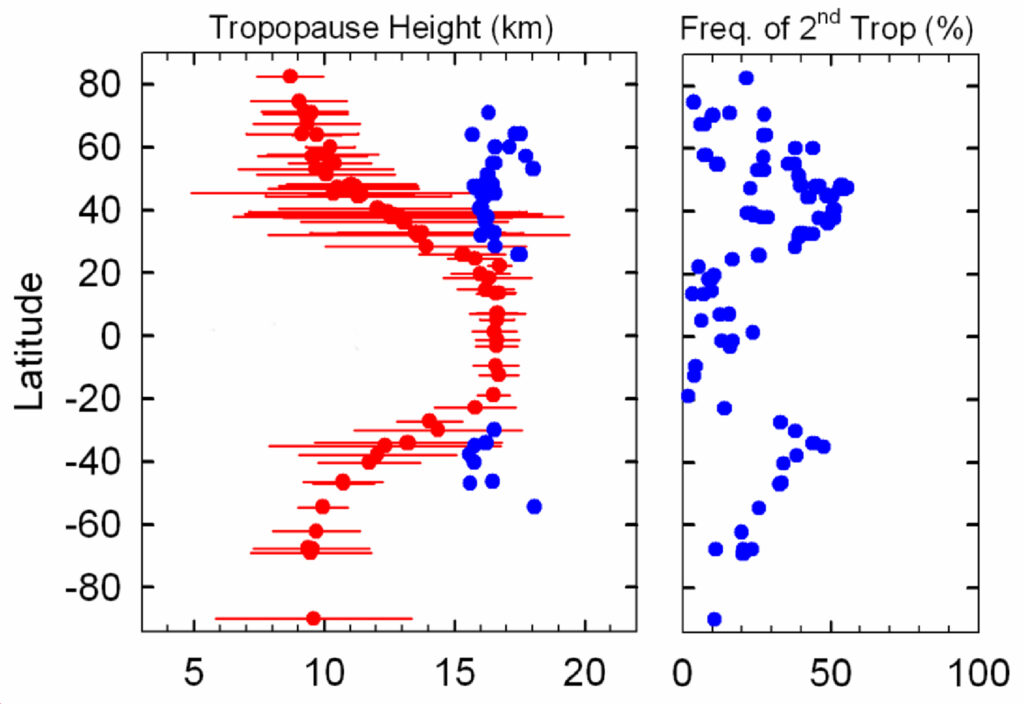
The height of the tropopause (red dots) and range of heights (red bars) measured by radiosondes throughout the world. A second tropopause (blue dots) is observed during the percentage of observations shown in the right-hand graph (Seidel and Randel, 2007).